
Bitcoin Approaches Key $83K Resistance Level
Bitcoin shows strengthening momentum with bullish signals and funding trends as markets watch $83K resistance for potential upside continuation.
- Bitcoin maintains strong structure above $80K support as buyers continue defending key accumulation zones.
- Weekly MACD crossover aligns with past rallies, indicating sustained momentum across higher timeframes.
- Funding rates stay positive, showing long dominance while reduced extremes suggest improved market balance.
Bitcoin continues to show strengthening market structure as traders focus on a critical resistance zone near $83,000. Momentum indicators and derivatives data point toward sustained activity following recent consolidation phases.
Intraday Recovery Establishes Strong Support Base
Bitcoin experienced early selling pressure before stabilizing within a defined range. The asset briefly declined toward the $78,000 region during heightened volatility. Buyers quickly absorbed supply, leading to a sharp recovery.
The rebound confirmed strong support between $78,000 and $79,000 levels. This zone now anchors short-term price stability. Bitcoin later reclaimed the $80,000 threshold, reinforcing bullish positioning.
Bitcoin as of writing is trading at $81,098 with improving structure. The formation of higher highs and higher lows remains intact. This pattern reflects sustained demand during intraday sessions.
Volume expanded significantly during the recovery phase. Increased participation supports the continuation of the prevailing trend. Market behavior remains orderly with controlled price swings.
Weekly Momentum Signal Aligns With Historical Trends
A widely circulated tweet referenced a bullish MACD crossover recorded on April 13. This signal has historically aligned with extended upward cycles. Bitcoin has already gained roughly 15% since the crossover.
Historical comparisons show similar setups preceding major rallies. October 2023 saw a 147% increase after a comparable signal emerged. Additional crossovers in 2024 and 2025 delivered gains of 75% and 35%.
The current structure reflects early stages of those expansions. Momentum indicators have reset following a corrective phase from higher levels. The MACD histogram turning positive supports renewed buying interest.
Weekly signals provide stronger confirmation than lower timeframe indicators. They reduce noise and reflect broader capital flow trends. Current alignment suggests continued participation from long-term market participants.
Funding Rates and Resistance Shape Near-Term Outlook
The OI-weighted funding rate remains largely positive throughout the observed period. This indicates that long positions continue dominating derivatives markets. Traders are paying premiums to maintain bullish exposure.
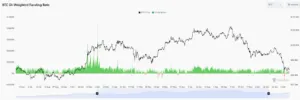
Source: Coinglass
Earlier phases showed stable funding rates during sideways accumulation. Later, spikes emerged alongside strong upward price movements. These spikes reflected crowded positioning and increased liquidation risk.
As of writing data shows moderation in funding levels despite continued positive readings. This suggests a more balanced structure with reduced leverage stress. Such conditions often support sustained trend development.
Bitcoin as of writing approaches the $83,000 resistance aligned with the 200-day average. A rejection may lead to consolidation within current ranges. A confirmed breakout could open the path toward $89,000 and $94,000 levels.


