


Ethereum Wyckoff Accumulation Nears Breakout Phase
Ethereum Wyckoff Accumulation Nears Breakout Phase
Meta Description: Ethereum is trading in a declining monthly pattern with Wyckoff accumulation maturing indicating compression before breakout.
- Ethereum is experiencing late-stage Wyckoff accumulation as the demand grows close to the long-term structural support.
- Ethereum derivatives data reflects bullish positioning alongside elevated liquidation sensitivity.
- Ethereum maintains balance near $3,000 while traders monitor $4,000 for structural confirmation.
Eth fluctuates in a falling monthly pattern following a duration of institutional purchases. Market data is providing contradictory reports on the short term but structural indicators are indicating that price compression is approaching a decisive resolution phase.
Wyckoff Accumulation Signals Structural Maturity
Eth has a clear Wyckoff accumulation pattern which formed following the 2021 distribution high. The stage A was characterized by trend exhaustion wherein Automatic Reaction and Selling Climax areas were developed. These levels created long-term price limits in the future. The organisation directed Ethereum to prolonged consolidation.
Phase B was done through increased re-accumulation characterized by repeated secondary tests. Volatility slowly narrowed out with weaker actors leaving. The absorption of supply continued regardless of the continued uncertainty. Institutional behavior remained consistent with composite operator positioning.
Phase C delivered a final shakeout below established support. Stop-loss cascades removed fragile long exposure efficiently. Price recovered quickly and decisively afterward. That response confirmed strong professional demand defending the lower range.
LPS Recovery Reinforces Demand Control
Ethereum has bounced back recently after the Last Point of Support with structural stability. The lows were higher and the accumulation range was already in place. Lower boundary retests lost prior momentum. Demand steadily replaced reactive selling pressure.
A Bitcoinsensus post stated accumulation appears nearly complete. The tweet referenced a Phase C to Phase D transition. It emphasized strengthening demand following the LPS recovery. The growth was perceived as structurally positive by the market participants.
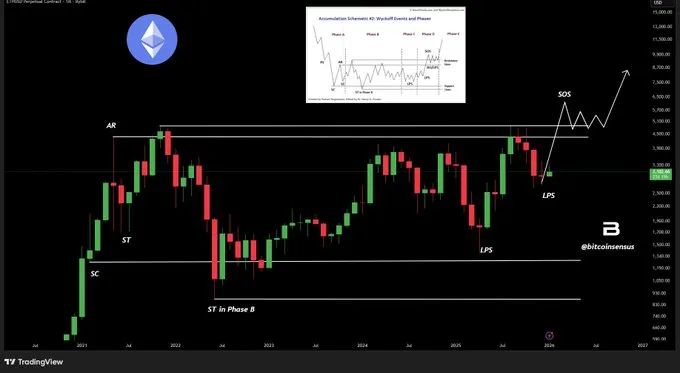
Source: X
The long-term resistance becomes oscillated under price with more and more restrained responses. Rallies seem to be better organized than the previous ones. Pullbacks are superficial and well-organized. These are conditions that are preparatory and not distributive.
Derivatives Positioning and Key Price Levels
Eth derivatives statistics shows a pessimistic short term outlook. The volume of trading dropped to around $75 billion in the last few sessions. Open interest narrowed down to about $39.9 billion. There was an increase in the option activity as traders preferred volatility exposure.
The long-short ratios are still biased towards bullishness in the key exchanges. Upside exposure remains popular with the professional accounts. Squeezed long positions were disproportionately hit by liquidations. The result of this imbalance is enhanced short term volatility sensitivity.
In the monthly chart, Ethereum is as of writing trading at $3,095. The $3,300-$3,400 zone remains active supply resistance. Support near $3,000 continues holding structurally. Market focus remains fixed on acceptance above $4,000 for confirmation.
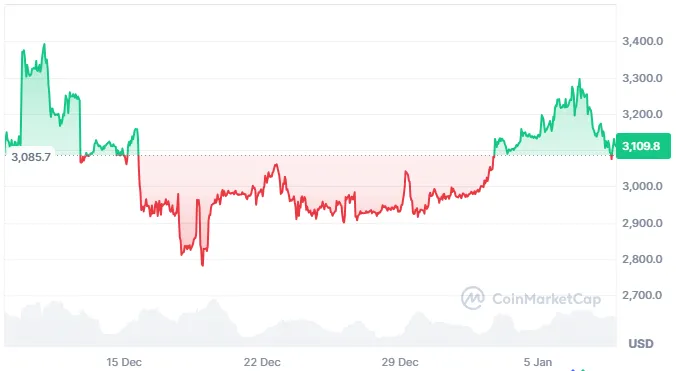
Source: Coinmarketcap