


Chainlink Falling Wedge Signals Key Breakout Watch
Chainlink Falling Wedge nears breakout as LINK defends support, with traders watching resistance after a recovery from intraday weakness.
- LINK defended the $7.85 support zone before recovering toward $8.00, keeping short-term bullish hopes intact after early weakness.
- A falling wedge continues compressing price action, leaving traders focused on a confirmed daily breakout above resistance.
- Lower trading volume during recovery suggests buyers need stronger participation for sustained upward momentum confirmation.
Chainlink Falling Wedge remains the central market focus as LINK approaches a decisive technical level after months of compression. Traders continue monitoring resistance while price action shows renewed buying interest following recent support defense.
Falling Wedge Nears a Critical Stage
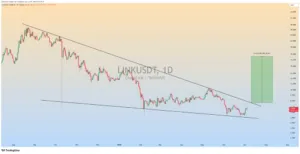
ZAYK Charts shared a daily chart featuring a long-term falling wedge pattern. The post projected a possible breakout after months of compressed trading. The setup attracted attention across the cryptocurrency market.
Source: X
The formation contains price within two descending trendlines. Lower highs define the upper boundary throughout the correction. Lower lows continue respecting the lower support trendline.
The wedge has developed across nearly one year of trading. Price gradually narrowed toward the pattern’s apex during that period. Technical traders often monitor this stage for breakout confirmation.
The chart previously showed LINK trading between $25 and $27. Extended selling later pushed prices steadily lower. However, repeated consolidation phases showed buyers remained active.
Support Holds While Resistance Remains Unbroken
LINK recently rebounded after testing the wedge’s lower support boundary. Buyers responded near that level during June trading. The reaction kept the broader pattern intact.
The shared projection targets the $9-$18 region. That objective depends on a confirmed breakout above resistance. Until then, the corrective structure technically remains unchanged.
The upper descending trendline continues limiting bullish momentum. A daily close above that barrier would change market structure. It would also interrupt the prolonged sequence of lower highs.
Historical trading zones support the projected recovery area. Previous support frequently becomes future resistance during recoveries. Traders continue watching those levels for follow-through buying.
Intraday Recovery Keeps Bulls Engaged
LINK as of the time of writing, traded at $8.01, reflecting a 0.77% daily decline. Early selling pressure controlled much of the session. Buyers regained momentum during later trading hours.
Price opened near $8.08 before declining steadily. The session eventually reached an intraday low near $7.85. That move represented roughly a 2.8% pullback from the day’s high.
Demand returned between the $7.85 and $7.87 support area. Price then recovered through a sequence of higher lows. The rebound carried LINK back toward the important $8.00 level.
Trading volume reached approximately $170 million during the session. Volume declined 18.52% compared with the previous day. Meanwhile, $7.85 serves as immediate support, while $8.08 to $8.10 remains the primary resistance zone awaiting confirmation.