
ETH/BTC Bottom Setup Gains Attention Near Key Fib Zone
ETH/BTC stabilizes near critical Fibonacci support as bullish divergence and accumulation signals strengthen market focus.
- ETHBTC defended the 0.75 Fibonacci pocket after completing a full macro corrective structure near February liquidity lows.
- Ethereum volume surged over 46% during weakness while RSI divergence signaled fading downside momentum pressure.
- ETHBTC consolidation near support continues attracting attention as Bitcoin dominance momentum gradually slows across markets.
ETH/BTC stabilized near a critical higher-timeframe support region after prolonged weakness against Bitcoin, while traders monitored developing bullish divergence signals and accumulation behavior following a completed macro corrective structure.
ETHBTC Completes Macro Retracement Structure
A recent market update from analyst Scient focused on ETHBTC’s completed macro corrective sequence. The structure originally began forming near the February lows during broader market weakness. Price later rallied for nearly three months before revisiting a major resistance zone.
The chart showed ETHBTC rejecting from the Daily MSS and breaker region afterward. That rejection confirmed broader bearish continuation rather than immediate trend reversal conditions. Price then rotated downward and swept liquidity resting beneath February support levels.
Scient also identified the completed fair value gap fill as structurally important. Fair value gaps often attract price before stronger directional movement eventually develops later. The chart suggests ETHBTC completed that rebalance after revisiting lower liquidity zones.
Another major focus involved the 0.75 Fibonacci retracement support pocket shown on-chart. The analyst described this region as the final meaningful higher-timeframe defense area. Failure to stabilize there could extend Ethereum’s relative weakness against Bitcoin further.
RSI Divergence Signals Possible Accumulation Phase
The lower timeframe structure revealed ETHBTC consolidating quietly near recent cycle lows. Price remained compressed inside a descending wedge formation for more than one week. That behavior aligned with slowing downside momentum across broader crypto trading conditions.
At the same time, the Relative Strength Index formed bullish divergence underneath price action. RSI printed higher lows while ETHBTC continued testing similar price support areas repeatedly. That divergence often reflects fading seller momentum during late-stage bearish market structures.
The chart also showed downside volatility gradually weakening after earlier impulsive declines. Previous selloffs developed aggressively with limited stabilization throughout broader corrective phases. Recently, however, price action became increasingly controlled near major support levels instead.
Scient noted the market still lacked full confirmation of a complete trend reversal. However, the analyst stated technical ingredients for a potential bottom were developing steadily. Momentum continuation and sustained higher lows remain necessary before broader bullish confirmation emerges.
Ethereum Recovery Attempts Narrow Bitcoin Performance Gap
Ethereum underperformed Bitcoin for most of the latest intraday trading session. ETH weakened rapidly while Bitcoin maintained relatively stronger positioning across broader markets. That divergence reinforced ongoing pressure surrounding Ethereum dominance against Bitcoin recently.
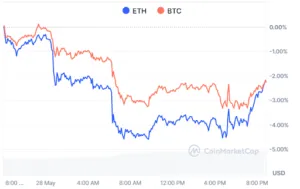
Source: Coinmarketcap
The sharpest decline occurred during the middle portion of the trading session. Ethereum dropped toward the negative 4.5% intraday performance region during accelerated selling. Bitcoin, meanwhile, remained closer to the negative 3% performance area throughout weakness.
Ethereum later entered a stabilization phase after the aggressive downside expansion slowed considerably. Price stopped printing sharp lower lows and formed a sideways consolidation structure afterward. The rebound phase later narrowed Ethereum’s relative weakness versus Bitcoin into the session close.
Ethereum at the time of writing traded near $2,021 during the session while volume increased more than 46%.
Market capitalization remained close to $243.9 billion despite continued ETHBTC relative weakness overall. Traders now watch whether Ethereum can sustain recovery momentum against Bitcoin moving forward.


