


Ethereum On-Chain Metric Signals Historic Bottom Zone
Ethereum enters a historic on-chain bottom zone as Relative Unrealized Profit revisits levels linked to previous accumulation phases.
- Ethereum’s Relative Unrealized Profit has returned to historical lows seen before earlier accumulation and recovery phases.
- Long-term holder stress has increased as unrealized gains faded following the prolonged market correction.
- Historical on-chain data places Ethereum within a zone previously associated with major cycle bottoms and accumulation.
Ethereum is showing renewed signs of long-term accumulation after a key on-chain profitability metric returned to historically depressed levels following an extended period of market weakness.
Relative Unrealized Profit Revisits Historical Range
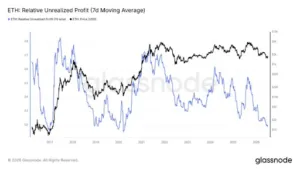
Crypto analyst Cryptollica shared on X that Ethereum has reached an important on-chain zone. The observation centers on Relative Unrealized Profit using a seven-day moving average. The metric has fallen into a range previously associated with major market bottoms.
Source: X
Relative Unrealized Profit measures aggregate unrealized gains across Ethereum holders. Elevated readings generally reflect widespread paper profits throughout the network. Lower readings indicate shrinking gains and growing financial pressure among investors.
The latest reading suggests most previous profit has already disappeared. That change reflects months of sustained price weakness and consolidation. The metric now resembles conditions recorded during earlier bear market endings.
According to the analyst, this positioning places Ethereum inside an established on-chain bottom zone. The assessment focuses on network behavior instead of daily price movements. It also relies on historical on-chain trends rather than short-term forecasts.
Historical Cycles Show Repeating Accumulation Pattern
The Glassnode chart compares Ethereum’s price with Relative Unrealized Profit over several market cycles. Similar declines appeared during the 2018 market downturn. Those readings later preceded an extended accumulation period before recovery emerged.
Comparable behavior also developed during the 2020 market correction. Relative Unrealized Profit dropped into the lower historical region once again. Ethereum later advanced into its strongest bull market during the following cycle.
The same relationship appeared after the 2021 market peak. Investor profitability steadily declined throughout the prolonged 2022 correction. As profits disappeared, speculative excess gradually left the market.
Rather than collapsing indefinitely, the indicator stabilized near historical support. Previous market cycles displayed comparable behavior before stronger recoveries developed. Consequently, the current reading continues attracting attention among on-chain analysts.
Holder Stress Reaches Levels Seen Near Previous Bottoms
The latest data reflects increasing financial pressure across Ethereum’s holder base. Unrealized profits have largely disappeared after months of declining prices. That environment typically represents maximum stress rather than growing optimism.
The chart also illustrates the relationship between market psychology and network profitability. Sentiment often weakens before prices establish durable recoveries. Historical data shows emotional resets frequently occur ahead of broader trend improvements.
Cryptollica stated that weaker holders often exit during prolonged corrections. Longer-term participants gradually absorb available supply throughout those periods. Similar redistribution phases accompanied previous Ethereum accumulation zones.
Ethereum currently trades below earlier cycle highs while on-chain stress remains elevated. The analyst identifies this combination as an established bottom region based on historical observations. Even so, the indicator identifies accumulation conditions instead of guaranteeing immediate price appreciation.