
Ethereum Price Holds $1,963 as Inverted Bullish Flag Forms
Ethereum Price trades near $1,963 as inverted 4-hour bullish flag pattern signals potential breakout toward higher resistance levels.
- Ethereum Price compresses within a 4-hour inverted bullish flag structure near $1,970 resistance.
- Intraday higher lows and strong rebounds show steady demand absorption above $1,940 support.
- A breakout from compression may mirror the prior impulse leg on the 4-hour chart..
Ethereum Price is consolidating near $1,963 after gaining 2.6% over 24 hours. The 4-hour structure shows compression beneath $1,970 resistance. Traders are closely watching a developing inverted bullish flag formation.
Inverted 4-Hour Structure Signals Continuation Setup
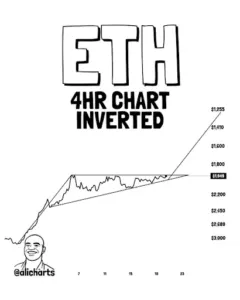
A recent tweet from Ali Charts described a bullish flag with a twist. He noted that the chart was presented in inverted form. This inversion reframes recent consolidation as constructive rather than corrective.
Source: X
On the inverted 4-hour chart, a sharp impulse leg is clearly visible. That move is followed by a tightening consolidation channel. Such formations often precede continuation when confirmed by expansion.
The diagonal boundary in the inverted view acts as structural support. Price compresses steadily toward the apex of the formation. Decreasing volatility often signals an approaching breakout phase.
A horizontal level near $1,949 appears critical in the inverted display. In normal orientation, that zone reflects meaningful support. Repeated tests suggest energy is building rather than breaking down.
Intraday Price Action Shows Higher Lows
Ethereum as of writing trades at $1,963.13 on major tracking platforms. The 24-hour range spans between $1,914 and $1,970. This relatively narrow band reflects controlled volatility conditions.
During early trading hours, price briefly dipped toward $1,920. Buyers quickly stepped in and reclaimed lost ground. The recovery formed a higher low within the session.
Later, a temporary decline below $1,940 triggered swift buying. The rebound was sharp and decisive. Such reactions often indicate responsive liquidity near known support.
Throughout the session, incremental advances replaced sharp rallies. Pullbacks around $1,950 remained shallow and short-lived. This behavior reflects steady absorption rather than aggressive selling.
Resistance, Volume, and Market Structure
Ethereum Price is now pressing the upper boundary near $1,970. Sustained trading close to daily highs often signals constructive positioning. However, repeated tests require confirmation through expansion.
Ali Charts projected upside levels using the inverted structure. Targets extended toward $1,800, $1,600, $1,410, and $1,255 on the inverted scale. When flipped, these represent higher potential price objectives.
Market capitalization stands near $237 billion with active liquidity. Twenty-four-hour trading volume exceeds $22 billion. Strong participation supports the validity of short-term formations.
Circulating supply is reported at roughly 120.69 million coins. There is no capped maximum supply within the protocol. Structural factors such as staking and fee burns continue shaping supply dynamics.
Ethereum Price now sits at a technical inflection point. Compression within the 4-hour structure narrows directional probability. A decisive move above $1,970 would confirm continuation, while $1,940 remains near-term support.


