
SHIB Tests $0.0000067 Resistance as Bulls Eye $0.0000099
SHIB approaches $0.0000067 resistance on the weekly chart, with $0.0000099 emerging as the next upside level upon confirmation.
- SHIB requires a weekly close above $0.0000067 to target $0.0000099.
- The $0.00000645–$0.00000666 intraday range defines immediate momentum bias.
- Weekly lower highs remain intact despite visible price compression.
SHIB is testing a decisive resistance zone on the weekly timeframe as traders evaluate structural strength. The token faces a pivotal reaction at $0.0000067, a former support turned resistance. Market focus now centers on confirmation through higher-timeframe closes.
Weekly Structure Signals a Critical Test
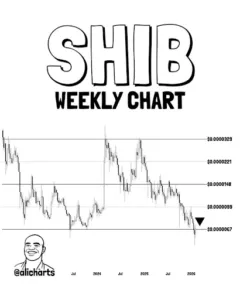
The weekly chart shows SHIB in a sustained downtrend since 2024. Price peaked near $0.0000329 before forming consistent lower highs and lower lows. That structure continues to define the broader trajectory.
The $0.0000067 level previously acted as durable horizontal support. Several rebounds developed from this zone during earlier consolidation phases. Recent weekly candles, however, closed below that threshold.
This breakdown converted $0.0000067 into resistance. Such role reversals often define structural turning points in trending markets. Price is now pressing directly against this barrier.
Crypto market commentary on X shared by analyst Ali Charts brought renewed attention to this setup. The post stated, “Shiba Inu $SHIB is testing a key level as resistance! Reclaim $0.0000067 as support, and $0.0000099 comes next.” That statement aligns with the visible horizontal structure on the chart.
Source: X
Intraday Range Defines Immediate Bias
SHIB is as of writing trading at $0.000006579 after a volatile session. The chart shows early upward movement followed by a sharp downside wick. Price briefly declined toward $0.00000645 before stabilizing.
The move lower resembles a liquidity sweep beneath short-term support. Stops positioned below that area were likely triggered during the decline. Buyers responded as price reclaimed the $0.00000655 region.
Immediate resistance stands between $0.00000665 and $0.00000666. Multiple rejections in this band indicate persistent selling interest. A sustained move above this range would improve short-term momentum.
Failure to break higher keeps the range intact. Acceptance below $0.00000655 increases the probability of another test of $0.00000645. That level now defines near-term structural support.
Upside Targets and Broader Supply Zones
A confirmed weekly close above $0.0000067 would alter short-term structure. Such a move would invalidate the recent breakdown. Attention would then shift toward $0.0000099 as the next resistance.
The $0.0000099 zone corresponds with prior consolidation. Selling pressure emerged there during earlier distribution phases. Market participants may expect supply to reappear upon approach.
Beyond that, $0.0000148 represents mid-range supply. Higher levels at $0.0000221 and $0.0000329 remain macro distribution zones. These areas frame any extended recovery attempt.
If price fails to reclaim $0.0000067, the bearish sequence remains active. Lower highs are still visible on the weekly chart. Until that structure changes, trend reversal lacks confirmation.


