
Shiba Inu Breakout Watch Builds Near Resistance
Shiba Inu breakout watch intensifies as price nears resistance, with volume signals and key levels guiding potential upside and downside scenarios.
- Shiba Inu holds above key support as repeated resistance tests near $0.0000064 tighten price structure.
- Breakout above resistance with volume may open path toward $0.0000072 and $0.0000080 targets.
- Declining volume and neutral structure reflect consolidation as traders await directional confirmation.
Shiba Inu breakout watch gains traction as price approaches a critical resistance zone. Market structure shows consolidation, while traders monitor volume behavior and key levels for confirmation of the next directional move.
Resistance Tests Shape Breakout Conditions
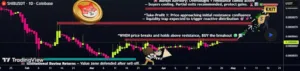
A recent post from TheCryptoBasic outlined a structured setup for Shiba Inu. The analysis referenced a prolonged consolidation phase with defined support and resistance levels. It presented a framework for a potential breakout scenario.
Price has repeatedly tested the $0.0000064 resistance level without sustained success. Each rejection has limited upward continuation, maintaining range-bound behavior. However, repeated tests often reduce selling pressure at that level.
Source: X
The chart shows tightening price action just below resistance. Candles have become smaller as volatility compresses within the range. This pattern is commonly observed before directional expansion.
TheCryptoBasic cited analyst “The-Thief,” who noted the importance of a confirmed breakout. A move above resistance requires strong volume support. Without volume, breakout attempts may fail and return to consolidation.
Support Recovery and Market Structure
Shiba Inu recently rebounded from a major support level near $0.0000053. This level has historically attracted buying interest during previous declines. The reaction marked a shift in short-term participation.
The recovery from support led to the formation of higher lows. This structure indicates gradual strengthening beneath resistance. It also reflects accumulation within the defined range.
A key invalidation level has been identified near $0.0000058. A close below this level would weaken the current structure. It would also break the sequence of higher lows.
At the time of writing, Shiba Inu traded at $0.000006095 with moderate activity. The price remains within the established range while testing resistance. This positioning keeps the breakout setup active.
Volume Trends and Target Levels
Market data shows a 24-hour trading volume of approximately $82.44 million. This represents a decline of 18.68% over the observed period. Reduced volume suggests lower participation during consolidation.
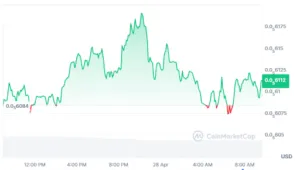
Source: Coinmarketcap
The volume-to-market-cap ratio stands near 2.29%, indicating limited liquidity flow. Lower liquidity conditions often slow price expansion. This aligns with the current range-bound structure.
If a breakout occurs, the first target is set near $0.0000072. This level aligns with a prior reaction zone where selling pressure may emerge. It serves as an initial checkpoint for price movement.
The second target is positioned near $0.0000080. This level represents a broader extension beyond the current range. Movement toward this zone depends on sustained momentum and volume confirmation.


