


SUI Breakout Setup Faces a Key Weekly Test
SUI breakout setup tightens as price holds support, while derivatives data shows falling activity and heavy long liquidations ahead.
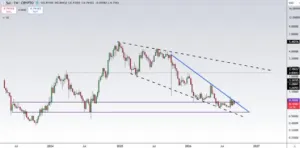
- Weekly structure shows a long falling wedge, while the broader DBW keeps price beneath descending resistance across the weekly chart.
- Derivatives activity has eased, with open interest and volume falling while long liquidations remain elevated across major markets.
- Price holds near $0.74, leaving the blue trendline and $0.78 area as key weekly references as the long-term structure develops further.
SUI breakout setup is tightening as price action remains near support, while derivatives activity declines and long liquidations remain elevated across markets, leaving the chart focused on its falling structures.
Weekly Structure Keeps Price Under Pressure
The weekly chart shows SUI trading inside a falling wedge spanning roughly 1.5 years. The upper boundary continues descending from the peak formed above $5. Meanwhile, the lower boundary has contained several declines and rebounds across the formation.
Source: X
The structure developed after SUI reached higher levels during late 2024. Price then entered a prolonged decline, creating a sequence of lower highs. Recent candles have instead compressed near the lower portion of the pattern.
The chart shows SUI near $0.74103, close to the $0.74 support reference. Another nearby horizontal level appears around $0.78 on the weekly structure. Together, these levels frame the latest consolidation near the wedge’s lower boundary.
The supplied post describes a broader, almost two-year-long DBW pattern. That larger formation extends beyond the smaller falling wedge visible on recent price action. Both structures keep attention centered on descending resistance above current trading levels.
Blue Trendline Remains the Main Breakout Level
The blue descending trendline currently marks the clearest resistance on the chart. It connects several lower highs formed during the prolonged decline. Price remains beneath this line after repeated attempts to recover.
The smaller falling wedge has narrowed as SUI moved through the recent months. Candles near support have become more compressed compared with earlier swings. That compression leaves the upper boundary increasingly close to current trading levels.
The post identifies a break above the blue line as the key technical event. Such a move would take price beyond the descending resistance defining the wedge. Until that occurs, the displayed pattern remains contained within its existing boundaries.
The chart also shows earlier rallies failing near descending resistance. Those reactions repeatedly returned price toward lower portions of the formation. Recent trading therefore continues the broader pattern without a confirmed trendline breakout.
Derivatives Data Shows Reduced Activity
The derivatives dashboard records volume at approximately $840.54 million. That figure represents a 23.12% decline from the previous reading. Open interest also fell 3.81%, reaching approximately $635.17 million.
The aggregate 24-hour long-short ratio stands at 0.8116. However, several exchange-specific metrics show higher long positioning among listed traders. Binance accounts record 2.2478, while OKX accounts show a ratio of 3.11.
Liquidation data shows heavier pressure on long positions across longer periods. Twelve-hour liquidations reached approximately $1.50 million, including $1.47 million from longs. Over 24 hours, total liquidations reached $3.15 million, with $3.11 million from longs.
The combined data shows reduced activity alongside elevated long-side liquidation totals. Meanwhile, price remains near the lower wedge boundary around $0.74. The weekly structure therefore continues to center on support and the blue resistance line.