
TAO Price Surge Signals Momentum Shift
TAO Price Surge gained strength after reclaiming support, while volume and momentum indicators signaled renewed bullish activity.
- TAO reclaimed a major support region after months of selling pressure and weak sentiment.
- Strong volume expansion accompanied the rally as momentum indicators turned higher.
- Traders now monitor the $280 to $320 area for broader trend confirmation.
TAO Price Surge attracted attention after Bittensor reversed sharply from support. Market data showed renewed buying activity after months of persistent weakness. Momentum indicators and rising volume accompanied the recovery phase.
Momentum Indicators Signaled Seller Exhaustion
Bittensor spent seven months declining from the $500 region. Repeated rallies failed during that prolonged corrective period. Market sentiment also weakened as confidence faded.
A post from market observer 2xnmore discussed the reversal. The commentary noted several technical signals before confirmation. Momentum indicators had already started improving during consolidation.
The daily RSI approached levels seen during previous lows. Similar readings had preceded earlier recovery attempts. Therefore, traders monitored those conditions closely.
Meanwhile, the MACD histogram compressed for several weeks. That pattern suggested bearish pressure was gradually fading. Buyers later gained control near established support.
Reclaimed Support Triggered Sharp Recovery
Price opened near $212 before revisiting January support. Buyers defended that region during the session. TAO later closed around $264 after a strong advance.
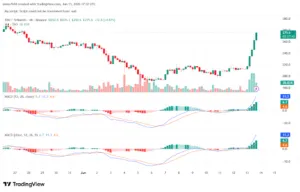
Source: Tradingview
According to the market commentary, the move was notable. The support area had previously turned into resistance. However, price reclaimed that level within one session.
The reversal candle also arrived with exceptional volume. Trading activity exceeded levels seen during recent months. Therefore, participation expanded alongside price appreciation.
On the four-hour chart, momentum accelerated quickly. Several bullish candles pushed price toward $275. Volume growth supported the upward movement.
Resistance Zone Becomes the Next Focus
The current structure places attention on higher levels. Traders are watching the $280 to $320 region. That zone marked the previous breakdown area.
The four-hour chart displayed a rounded bottom formation. Support developed near the $190 and $195 region. Consolidation later formed between $200 and $220.
MACD readings strengthened as the rally accelerated. Histogram bars expanded further into positive territory. Momentum continued increasing during the breakout phase.
The commentary from 2xnmore also referenced sentiment conditions. There was a lot of bear sentiment leading up to the rally. Market participants now watch whether higher resistance levels are reclaimed.
Within the broader structure, as of writing, price traded above $270. Pullbacks toward former resistance could attract attention. Market participants continue assessing trend confirmation.


