
Total Crypto Market Cap Outlook Tracks Cycle Correction and Liquidity Shifts
Total Crypto Market Cap Outlook tracks deep correction levels, demand zones, liquidity concentration, and projected expansion across decentralized trading ecosystems and market cycles
- Total market capitalization remains within historical correction ranges, with demand zones forming near major liquidity clusters across macro cycles
- Liquidity concentration across leading decentralized exchanges continues shaping capital flows and reinforcing dominant trading infrastructure across networks
- Resistance reclaim levels remain central to expansion forecasts, with structural recovery historically following deep cycle retracements and accumulation phases
Total Crypto Market Cap Outlook is shaping attention as macro cycle retracement aligns with expanding market structure. Participants monitor liquidity behavior across exchanges while structural corrections interact with long-term growth expectations globally.
Macro Cycle Correction Mirrors Historical Market Structure
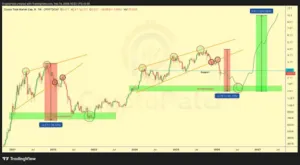
A widely shared tweet from Crypto Patel described current market positioning within historical correction ranges. The post identified deep retracement as consistent with prior cycle resets preceding major expansion phases. Projected targets extend toward multi-trillion valuations once resistance reclaim confirms structural trend continuation.
Source: X
The chart shows descending channel movement following peak valuation levels across the broader market. Repeated rejection zones indicate persistent selling pressure during recovery attempts within corrective structure phases. Such behavior reflects controlled distribution rather than disorderly contraction across macro cycle transitions.
A defined demand zone appears between approximately $1.4 trillion and $1.7 trillion capitalization levels. Historical interaction with comparable ranges produced sharp reversals after liquidity absorption stabilized pricing conditions. Market structure currently approaches these ranges following a decline from higher valuation peaks.
The tweet noted prior cycle drawdowns exceeding seventy percent before sustained parabolic recovery phases emerged. Comparative retracement depth supports structural similarity between present conditions and earlier expansion cycles. Market participants continue monitoring support interaction for signs of stabilization and accumulation activity.
Resistance Thresholds and Liquidity Behavior Guide Recovery
The dataset shows total crypto market capitalization near $2.4 trillion within broader corrective positioning. Daily trading volume exceeds $92 billion across centralized and decentralized trading environments globally. Bitcoin dominance remains above 58%, while Ethereum maintains approximately 10.5% share.
Resistance reclaim levels near $2.5 trillion function as macro confirmation thresholds for expansion. Repeated interaction with these levels suggests unresolved selling pressure within recovery attempts. Sustained movement above resistance historically precedes accelerated market valuation growth phases.
Projected liquidity sweeps near lower support zones often precede directional reversals within cyclical markets. Temporary downside extensions frequently trigger stop losses before renewed accumulation stabilizes price structure. Recovery projections within the chart reflect this recurring liquidity reset behavior.
Long-term trend support drawn across prior cycle lows remains structurally intact across multi-year periods. Corrections within established upward trajectories frequently reset market positioning without altering macro direction. Participants track these supports to evaluate broader trend continuity during retracement phases.
Liquidity Concentration Across Decentralized Trading Ecosystems
Liquidity distribution across decentralized exchanges reveals strong concentration within established trading infrastructures. Pancake Swap v2 records the largest trading volume and liquidity share across visible markets. Its market share approaches seventeen percent, reflecting strong engagement within the BNB Smart Chain ecosystem.
Uniswap maintains sustained liquidity depth across multiple protocol versions operating simultaneously. Combined activity reflects capital retention within a single ecosystem rather than fragmented migration. Ethereum continues functioning as a primary liquidity anchor despite transaction cost considerations.
Curve holds substantial liquidity focused on stable asset trading efficiency.
Its structure prioritizes capital stability rather than maximizing transactional volume across diverse pairs. This specialization supports targeted market segments within broader decentralized liquidity infrastructure.
Emerging platforms such as Hyperliquid combine orderbook models with decentralized settlement systems. These designs reflect experimentation beyond automated market maker frameworks dominating decentralized trading. Liquidity concentration patterns continue shaping capital allocation across evolving trading architectures globally.


