


Bitcoin Cycle Signals Point Toward a 2026 Bottom
Bitcoin cycle signals suggest a possible 2026 bottom as volume shifts and historical timing puts August through December under scrutiny.
- Historical cycle spacing points toward September 2026 as a possible Bitcoin market bottom, though timing remains uncertain.
- Bitcoin trading volume expanded during major advances and declines, showing stronger participation across the current market cycle.
- Price action remains below a major trendline, making confirmation essential before any broader cycle reversal can be established.
Bitcoin cycle analysis is drawing renewed attention as historical timing, market volume, and weakening structure converge around a potential 2026 turning point.
Historical Timing Puts September Under Watch
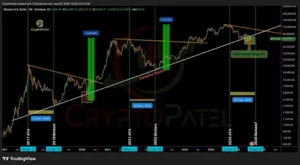
Crypto Patel recently presented a historical comparison suggesting Bitcoin may approach cycle exhaustion soon. The analysis places roughly two months between the current phase and September 2026. That projection relies on recurring intervals observed across earlier Bitcoin market cycles.
Source: Crypto Patel via X
The chart compares the 2017 peak with its 2018 bottom. It also compares the 2021 peak with the 2022 bottom. A similar interval now follows the latest major cycle peak. The highlighted measurement spans approximately 52 bars, representing 364 days.
According to the analysis, August through December could become an important market window. September receives particular attention because the historical measurements point toward that period. However, the projected date remains dependent on historical patterns repeating again.
The earlier cycles also recorded substantial recoveries following major bottoms. One advance measured approximately 1,648%, while another reached nearly 714%. Those figures provide historical context rather than guarantees for the current market.
Current Price Structure Still Requires Confirmation
Bitcoin as of writing trades at $64,935.72, according to the supplied market data. The asset has gained 0.84% over 24 hours and 3.28% over seven days. Daily trading volume stands near $21.38 billion.
Despite the recent gains, the chart shows Bitcoin trading beneath an important rising trendline. The displayed structure indicates that price previously closed below that trendline. This keeps the broader reversal thesis technically unconfirmed for now.
The recent decline followed a move toward the $120,000 region, according to the supplied chart. Bitcoin subsequently retreated toward the $80,000-$90,000 area. That decline occurred alongside substantial market activity rather than extremely thin trading conditions.
Consequently, the next directional move carries greater technical importance. A recovery above the broken structure could strengthen the developing reversal case. Another breakdown accompanied by heavy volume could instead indicate continuing distribution.
Volume Offers Another Measure of Market Strength
The volume chart shows activity increasing during Bitcoin’s strongest advances. Larger volume bars appeared as price accelerated toward higher levels. This suggests that major price movements attracted broader participation across the market.
However, volume also increased during the subsequent decline. Heavy activity during falling prices can accompany distribution, profit-taking, or liquidation. Therefore, elevated volume alone cannot establish whether accumulation or selling currently dominates.
The latest section shows price stabilizing while volume continues to fluctuate. That combination can occur during periods of competition between buyers and sellers. A sustained advance with expanding volume would provide stronger evidence of renewed demand.
For the broader Bitcoin cycle, the timing and volume signals should therefore remain separate. Historical patterns suggest a possible September turning point, while current price structure still requires confirmation. August through December could consequently become a closely watched period for evidence of accumulation and renewed trend strength.