


Bitcoin Support Weakens as BTC Falls 32% in 45 Days
Bitcoin support faces another test as BTC falls 32% in 45 days, with oversold indicators and bearish momentum raising downside concerns.
- Bitcoin has fallen nearly 32% in 45 days, dropping from $87,395 toward $59,200 as selling pressure intensifies.
- RSI has dropped to 17.09, while negative MACD readings confirm persistent bearish momentum across the daily trading chart.
- The $57,800 historical low remains important, while $62,831 and $69,342 represent resistance levels for recovery attempts.
Bitcoin support faces renewed pressure after a sharp correction erased nearly $28,000. Technical indicators now show persistent selling, raising questions about further downside.
Bitcoin’s 32% Correction Raises Fresh Support Concerns
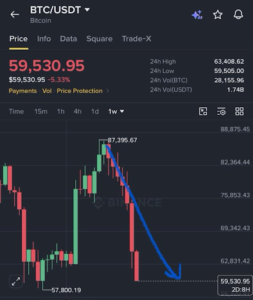
Crypto GVR recently highlighted Bitcoin’s sharp decline from its recent peak. The cryptocurrency dropped from approximately $87,395 to $59,530 within 45 days. This represents a decline of nearly 32%, or approximately $28,000.
Source: Crypto GVR via X
The weekly chart shows a sustained downward movement following the recent peak. Successive selling waves pushed BTC through several previously established price regions. Consequently, the market surrendered much of its earlier recovery.
The latest daily chart places Bitcoin around $59,208, down 4.79%. Its displayed session low reached approximately $58,948 during trading. Meanwhile, reported trading volume stood near $1.74 billion in USDT.
The previous recovery had lifted BTC from approximately $57,800 toward $80,000. However, sellers eventually interrupted that upward movement near $87,395. The subsequent reversal has returned attention toward earlier support levels.
Oversold Indicators Confirm Persistent Bearish Momentum
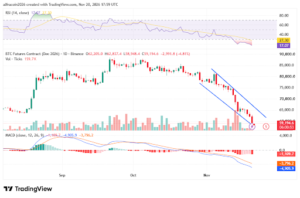
The daily futures chart shows Bitcoin trading within a descending channel. Its structure contains successive lower highs and lower lows. This formation indicates that sellers continue controlling the broader price direction.
Source: Tradingview
The Relative Strength Index currently stands at approximately 17.09. This reading falls considerably below the conventional oversold threshold of 30. Its accompanying moving average also remains elevated at approximately 27.30.
Such readings indicate exceptionally weak buying momentum across the market. However, deeply oversold conditions do not automatically establish a market bottom. Bitcoin could remain under pressure despite its depressed momentum readings.
The MACD provides further evidence of the prevailing bearish conditions. Its main line stands near -4,904.8, below the signal line. The histogram also remains negative at approximately -1,108.8.
Both MACD lines remain below the zero threshold. This positioning reflects persistent weakness beyond ordinary short-term price fluctuations. A bullish crossover would provide an early indication of changing momentum.
Bitcoin Must Defend Historical Lows Before Recovering
The $57,800 region represents an important historical reference point. Bitcoin previously found buyers around this level before recovering. Another approach could test whether demand remains strong enough.
A decisive breakdown beneath this region would weaken the recovery outlook. It could also expose BTC to additional selling pressure. Traders would consequently monitor subsequent price action for further weakness.
On the recovery side, $62,831 represents nearby resistance. Reclaiming this level could indicate improving short-term buying interest. However, buyers would still face another hurdle around $69,342.
The descending channel remains an obstacle to sustained recovery. A convincing move above its upper boundary would improve the technical picture. Stronger momentum readings would also help support a reversal attempt.
As of writing, Bitcoin support remains central to the market outlook. The $58,948 session low and $57,800 historical level deserve attention. A sustained defense could provide conditions for a relief rally. Nevertheless, further declines remain possible while sellers maintain control.
The next price movements will help establish the correction’s direction. Oversold indicators warrant attention, but confirmation requires stronger buying activity. Until resistance levels are reclaimed, the broader technical structure remains bearish.