


Ethereum Accumulation Returns as Momentum Signals Improve
Ethereum accumulation signals return as RSI and MACD improve, while bearish EMAs and weaker trading volume continue limiting recovery.
- Ethereum accumulation signals have returned after another decline, with current price levels resembling previously established demand zones.
- RSI is recovering and MACD is developing bullish momentum, although bearish EMAs continue reflecting the broader downward trend.
- Trading volume remains below previous rally peaks, leaving renewed buying participation important for confirming Ethereum’s recovery.
Ethereum accumulation is returning after another market decline, as improving technical indicators suggest changing momentum despite persistent bearish pressure.
Ethereum Accumulation Signals Reappear Following Another Decline
CW (@CW8900) reports renewed accumulation signals as Ethereum approaches a previously established trading range. The analyst identifies similarities between current price levels and earlier accumulation zones. Meanwhile, RSI and MACD readings are improving, although the EMA structure remains bearish.
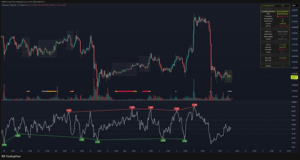
Ethereum’s earlier price action featured an extended period of sideways trading. That structure eventually weakened around late July, triggering a sharp downward movement. Trading volume expanded considerably as sellers gained control of the market.
Following that decline, ETH began establishing another consolidation range. Buyers appeared around previous demand areas, absorbing some available selling pressure. This period of sideways movement preceded another attempt to recover.
The subsequent advance towards August attracted stronger buying activity. However, sellers eventually interrupted the recovery with another aggressive decline. ETH consequently returned towards its earlier trading region, bringing renewed accumulation signals.
RSI and MACD Improve While Bearish EMAs Persist
The Relative Strength Index has started recovering after its previous decline. Its upward movement suggests selling pressure has weakened from earlier levels. However, sustained improvement remains necessary to support further price appreciation.
The Moving Average Convergence Divergence indicator is also developing bullish momentum. This suggests shorter-term momentum is improving following the recent downturn. Together, these readings indicate changing conditions within Ethereum’s technical structure.
However, the Exponential Moving Average structure continues reflecting bearish momentum. This suggests the broader downward trend remains intact despite improving oscillator readings. Ethereum therefore lacks confirmation of a sustained bullish reversal.
Ethereum as of writing trades at $2,236.11, with daily trading volume reaching approximately $11.57 billion. Its price increased 0.42% over the preceding 24 hours. However, the seven-day performance recorded a decline of 0.07%.
Ethereum Trading Volume Shows Changing Market Participation
Historical volume readings provide additional context for Ethereum’s recent price movements. Between August and November, ETH approached $5,000 during its strongest visible rally. Daily trading volume simultaneously climbed towards approximately $250 billion.

Source: Coinglass
However, elevated trading activity did not prevent the subsequent correction. Ethereum retreated towards $3,000 as selling pressure increased across trading sessions. Volume initially remained elevated before declining alongside weaker market activity.
Earlier price movements also demonstrate the relationship between participation and direction. Between March and April, ETH advanced towards $4,000 alongside increasing volume. Another upward movement around November and December attracted stronger trading activity.
The February and March correction brought another period of considerable price movement. ETH approached the 1,500–2,000 regions before beginning another recovery. Trading activity fluctuated throughout this period as market conditions continued changing.
More recently, Ethereum has traded around the 2,500–3,000 regions. However, current volume remains below previous major rally levels. Several isolated spikes indicate renewed interest without comparable expansion in price.
The next recovery attempt will depend partly on stronger buying participation. Rising prices accompanied by expanding volume would provide additional confirmation. Conversely, another breakdown could weaken the developing accumulation structure and renew selling pressure.