
LINEA Price Outlook Signals Channel Breakout Setup After 123% Weekly Surge
LINEA price trades at $0.00003468 after a 123% weekly surge, forming a descending channel with breakout signals building
- LINEA price rebounds 123% weekly as descending channel support holds firm.
- Daily structure shows seller exhaustion near lower channel boundary.
- Breakout above channel resistance may shift trend momentum upward.
LINEA price is drawing renewed attention as technical structure aligns with a potential reversal pattern. Market participants are watching closely as price action approaches a decisive inflection within a long-standing descending channel.
Descending Channel Structure Signals Possible Reversal
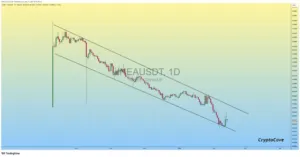
The daily chart shows LINEA price trading inside a defined descending channel. Lower highs and lower lows shaped this corrective structure for months. Both channel boundaries were respected with notable technical precision.
Price recently tested the lower boundary and produced a sharp rejection wick. That reaction suggested demand absorption at structural support. The bounce followed a prolonged phase of steady downside pressure.
The recovery appears firmer than previous relief rallies within the channel. Earlier rebounds failed near the midline resistance. However, the current consolidation displays tighter price compression.
Such compression near support often precedes volatility expansion. A sustained move toward the upper boundary would confirm strengthening demand. The structure now resembles a base forming inside the lower channel quadrant.
Market Reaction Follows Technical Commentary
A market commentary posted by Captain Faibik on X added momentum to the narrative. The tweet stated that LINEA seems bottomed and ready to bounce back. It also projected a possible upside channel breakout soon.
Source: X
That assessment coincides with improving short-term performance metrics. Linear (LINA) as of writing trades at $0.00003468 with a 24-hour volume of $1,031.54. The token recorded a 12.62% daily gain and a 123.89% weekly increase.
The sharp weekly appreciation followed extended downside consolidation. Rapid gains after prolonged compression often attract renewed speculative flows. Market behavior suggests participants are repositioning near structural support.
Despite the rally, the broader trend remains technically constrained. The descending resistance trendline still caps bullish continuation. A confirmed daily close above that level would alter the prevailing structure.
Breakout Threshold Defines Near-Term Direction
The upper boundary of the descending channel represents the critical trigger level. A decisive breakout would invalidate the sequence of lower highs. That structural shift could transition LINEA price into expansion mode.
Measured move projections typically mirror the channel’s height. Such projections would target previous consolidation zones above current levels. However, confirmation depends on sustained momentum above resistance.
Until then, risk remains defined beneath recent swing lows. The lower channel boundary continues to serve as structural support. Repeated defenses of that zone indicate diminishing selling pressure.
Momentum shifts often begin with subtle structural changes. Higher lows on lower timeframes would reinforce accumulation signals. Traders now monitor whether LINEA price can reclaim channel resistance decisively.


