


Shiba Inu Price Outlook Tests $0.000005 Resistance
Shiba Inu price outlook remains cautious as SHIB trades inside a descending channel, despite restored withdrawals and improving momentum.
- SHIB gained 3.02% to $0.00000477, but its daily chart remains inside a descending channel beneath resistance near $0.00000500.
- RSI climbed to 42.92 while MACD remained negative, suggesting selling pressure may be easing without confirming a bullish reversal.
- Withdrawals have resumed across nine networks, restoring transfer access, though the announcement provides no evidence of fresh buying demand.
Shiba Inu price outlook remains cautious as SHIB attempts recovery within a descending channel. Restored withdrawals across nine networks add an operational development to the picture.
SHIB Recovery Meets Descending Resistance
BSCN Newswire reported that SHIB withdrawals have resumed across nine networks. The restoration follows a temporary pause affecting transfers across supported services. However, the announcement does not identify those networks or explain the suspension.
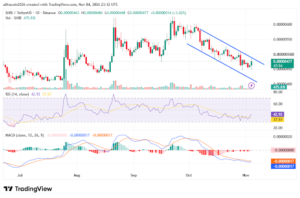
The daily chart shows SHIB gaining 3.02% to $0.00000477. Price opened at $0.00000463 and reached an intraday high of $0.00000486. Its session low stood at $0.00000448, keeping support firmly in focus.
Despite the latest gain, the broader chart still shows lower highs. Two descending trendlines outline a channel that has contained recent trading. SHIB remains below its upper boundary, leaving resistance unresolved.
The decline followed an earlier peak near $0.00000600. Since then, sellers have repeatedly pushed prices toward lower trading levels. The latest green candle offers relief, but not a confirmed trend reversal.
Support and Resistance Define the Next Move
The $0.00000450 region provides the nearest important support reference. It sits close to the latest session’s low and recent price action. A sustained break beneath it could expose the channel’s lower boundary.
Source: Tradingview
That lower boundary as of writing approaches the $0.00000420 area. A move toward that level would extend the existing decline. Buyers would need to defend support to prevent further technical deterioration.
On the upside, $0.00000500 represents the first major obstacle. This area also sits near the descending channel’s upper trendline. A daily close above it would offer stronger evidence of recovery.
Beyond that level, resistance appears around $0.00000550. The previous peak near $0.00000600 remains a larger upside reference. Reaching those levels would require sustained buying and stronger momentum.
Momentum Improves While Network Access Returns
The RSI has climbed to 42.92, with its average at 37.57. Its upward turn suggests momentum has improved after recent weakness. However, the indicator remains below 50, leaving bullish control unconfirmed.
The MACD presents a more cautious reading. Both lines remain near negative 0.00000017, while the histogram approaches zero. This narrowing suggests bearish momentum may be fading, although no bullish crossover appears.
Trading volume reached approximately 475.02 billion SHIB during the session. The increase accompanied the latest recovery, showing measurable market participation. However, the chart does not establish a decisive volume breakout.
The withdrawal restoration also improves access for affected SHIB holders. Users can again transfer supported holdings across the restored networks. Still, restored transfers do not establish increased demand or explain price movements.
BSCN’s wider SHIB coverage includes Shibarium, burn campaigns, and exchange developments. Those subjects provide additional context for the project’s ecosystem activity. For now, traders face a clear technical test near $0.00000500.
A breakout could challenge the descending structure, while rejection keeps support exposed. The $0.00000450 level remains important during any renewed selling. Until resistance breaks, the broader chart continues to favour caution.