


SUI Eyes $2.70 After Extended Consolidation
SUI remains in focus as traders monitor a long-term consolidation pattern that could support a move toward $2.70.
- SUI continues trading above a key historical support zone after a prolonged correction phase.
- Previous consolidation periods preceded gains exceeding 5x, according to historical chart data.
- Technical projections identify $2.70 as a potential recovery target if momentum returns.
SUI remains under close observation as traders assess whether an extended consolidation structure could lead to another expansion cycle, following a historical pattern that previously produced a substantial upward move.
Historical Consolidation Pattern Returns to Focus
SUI has attracted renewed attention following recent technical analysis observations. Market participants are comparing current price action with previous market cycles. Historical chart structures remain central to this assessment.
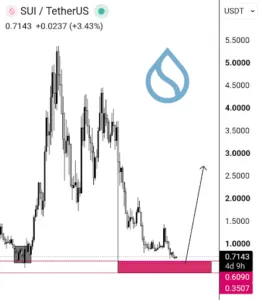
The latest analysis shared by the Sui community identified similarities between accumulation phases. According to the shared chart, previous consolidations preceded major rallies. Traders continue evaluating whether comparable conditions have emerged.
Source: X
During its earlier market cycle, SUI consolidated within a prolonged trading range. That period eventually produced a breakout exceeding five times the accumulation value. The resulting advance pushed the asset above previous market expectations.
The current structure has developed after an extended correction phase. Price behavior has remained relatively compressed during recent months. This pattern has increased attention among technical market participants.
Market Structure Suggests Ongoing Accumulation
The Sui community noted that SUI has yet to complete a second consolidation phase. Historical cryptocurrency market cycles have frequently featured repeated accumulation periods. These phases often precede renewed directional movements.
After reaching highs above $5.00, SUI entered a prolonged decline. The correction produced lower highs and reduced volatility. Market momentum also weakened during this period.
Technical analysts often interpret extended consolidations as market reset phases. During these periods, speculative activity frequently decreases. Longer-term positioning activity may gradually increase.
At the time of writing, SUI traded at $0.7338. The asset recorded a 3.11% gain over 24 hours. Weekly performance showed an increase of 9.67%.
Support Structure Maintains Focus on $2.70 Target
The chart identified the support region between $0.35 and $0.60. This area remains a central component of the bullish framework. Historical accumulation zones often attract renewed market interest.
Repeated support defense near the $0.70 region has also attracted attention. Sellers have struggled to maintain sustained downside momentum. This behavior frequently precedes larger directional moves.
According to the analysis shared on social media, the next projected target remains $2.70. This objective was derived from historical market structure observations. The target remains below previous cycle highs.
The Sui community emphasized that technical analysis focuses on probabilities. Confirmation of a new expansion phase requires additional market evidence. Price strength, participation, and breakout confirmation remain critical factors.