


XRP Price Rebound Tests Key Resistance
XRP price rebounds from $1.357 as buyers approach $1.55 resistance, with $1.60 and $1.70 remaining key upside levels ahead.
- Buyers defended $1.357 and lifted XRP toward $1.46, keeping the recovery structure intact despite recent selling pressure.
- A break above $1.55 could expose $1.60, while $1.70 remains the next major resistance from the earlier rally.
- RSI at 66.83 confirms stronger momentum, although buyers still need channel resistance clearance for continuation.
XRP price has rebounded from a key support zone, bringing buyers back toward resistance after a sharp correction from August highs.
Buyers regain control after the correction
Levi | Crypto Crusaders said XRP bulls were back after the latest rebound. The post noted $1.46 was holding following a bounce from $1.357. It also pointed toward $1.55, $1.60, and $1.70 as successive resistance levels.
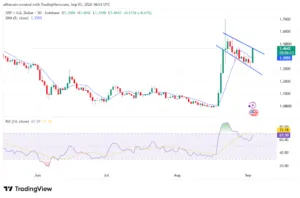
The daily chart shows a strong recovery from the $1.00 region. Price spent weeks creating lower highs and lower lows before reversing sharply. That reversal eventually carried XRP toward the $1.70 area.
The subsequent decline produced a clear corrective structure on the chart. Price moved lower while remaining inside two descending trendlines. Buyers then appeared around $1.357, preventing deeper losses.
The latest candle confirms renewed demand following that support test. XRP opened near $1.3506 before reaching approximately $1.4692. It eventually closed around $1.4566, producing a 7.84% daily increase.
$1.55 becomes the immediate technical hurdle
The rebound has returned XRP toward the upper boundary of its descending channel. That trendline currently creates resistance around the $1.50-$1.55 region. Buyers therefore face an important test after the latest upward move.
A sustained break above $1.55 would weaken the current corrective formation. Such a move could shift attention toward the $1.60 resistance area. The previous rally provides additional resistance near $1.70.
The $1.70 level remains important because price previously reversed sharply there. Sellers appeared after the earlier surge reached that region. Consequently, another approach could produce renewed selling pressure.
However, the current structure differs from the earlier vertical rally. Price is now attempting to build support following a substantial retracement. That process could provide a more stable foundation if buyers maintain control.
Momentum strengthens as buyers challenge resistance
The nine-day moving average currently sits near $1.3947 on the daily chart. The latest candle pushed XRP back above that moving average. This development places short-term momentum in a stronger position.
Source: Tradingview
The RSI currently reads 66.83, showing a substantial recovery in buying momentum. It remains below the traditional 70 overbought threshold. Therefore, the indicator has not yet entered an extended condition.
Still, RSI is approaching the upper momentum zone after recovering from August weakness. Another sharp advance could push the indicator above 70. That would signal stronger momentum while also raising short-term extension concerns.
The main downside reference remains the $1.357 support area. A sustained break below that level would weaken the current recovery structure. Conversely, holding support while clearing $1.55 would strengthen the bullish technical setup.
The chart therefore presents clearly defined levels for both buyers and sellers. Support remains concentrated around $1.35-$1.36, while resistance begins near $1.50-$1.55. The next decisive breakout or rejection should establish XRP’s immediate technical direction.