


Crypto Market Cap Nears $3T as ETF Flows Rise
Crypto market cap nears $3 trillion as ETF inflows strengthen, while recent gains push total valuation toward a key market threshold.
- Total crypto valuation has climbed toward $3 trillion. The market recovered from roughly $2.1 trillion during the displayed period.
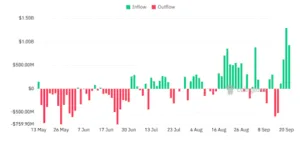
- ETF flows shifted sharply positive in August and September. The strongest inflow approached $1.3 billion near September 20 on chart.
- The market approached $3 trillion after breaking its range. Consolidation had held between roughly $2.5 trillion and $2.7 trillion.
Crypto market cap is nearing $3 trillion after a broad recovery. Stronger ETF inflows accompany the latest advance. The displayed data shows rising valuation alongside improved flows.
Market Capitalization Approaches $3 Trillion
ALLINCRYPTO recently noted that total crypto market capitalization was nearing $3 trillion. The post questioned whether the market could eventually reach $5 trillion, $6 trillion, or $7 trillion. The accompanying chart shows capitalization approaching $2.97 trillion after recovering from roughly $2.1 trillion.
The earlier advance carried capitalization from around $2.1 trillion toward $2.5 trillion. Market activity then moved sideways as valuations fluctuated within the broader range. That pause preceded the stronger breakout toward the $2.8 trillion area.
The latest candles show sharp acceleration after the consolidation period ended. Total valuation then moved rapidly toward the $3 trillion level. The chart records its strongest upward movement near the displayed period’s end.
The current level places the market near a major round-number threshold. The $3 trillion area now sits directly above the latest reading. The move added roughly $870 billion from the displayed low near $2.1 trillion.
ETF Flows Shift Toward Stronger Inflows
The 90-day ETF chart shows a clear change in daily flow direction. May and June contain numerous red bars representing ETF outflows. Several withdrawals reached between roughly $500 million and $750 million.
Source: Coinglass
Positive flows became more frequent during late June and July. Green bars during this period generally remained below later peak inflows. Red bars still appeared regularly, keeping the flow pattern mixed.
The shift became clearer during August as larger green bars emerged. Several inflows reached approximately $500 million to $850 million. Although withdrawals continued, positive sessions became more prominent across the displayed period.
September produced the strongest inflow readings shown on the chart. One green bar approached $1.3 billion, while another neared $900 million. These readings exceeded most positive flows recorded earlier.
Market Recovery Aligns With Recent ETF Activity
The two charts show stronger market valuation alongside improving ETF flow conditions. The market moved higher as positive ETF sessions became larger and more frequent. However, the charts do not establish that ETF flows directly caused valuation gains.
The latest market structure follows a breakout from the $2.5 trillion-$2.7 trillion range. Capitalization then moved above $2.8 trillion before approaching $3 trillion. This sequence marks a clear change from earlier sideways trading.
The second chart also shows that negative flows have not disappeared. September includes a red bar approaching $600 million before stronger inflows appeared. Therefore, ETF activity remains mixed despite recent positive readings.
The displayed data places current attention on the $3 trillion threshold. ETF flows have also reached their strongest positive levels within ninety days. Together, the charts show recovery alongside increased ETF inflow activity.