


SUI Price Tests $1.42 Trend-Change Level
SUI price is testing $1.42 as the key weekly threshold, while liquidation data shows heavy red-side unwinding across major exchanges.
- SUI price is testing $1.42, a weekly level that could confirm a shift from the long descending structure toward a broader recovery phase.
- A rejection below $1.42 could return SUI toward the $0.84-$0.70 accumulation zone, keeping the prior recovery structure under review.
- Liquidations remain heavily concentrated on the red side, led by Coinbase, OKX, and Upbit across the major exchanges shown on the chart.
SUI price has reached a critical weekly threshold after recovering from months of declining market structure and accumulation.
SUI Reclaims Its Descending Structure
SUI is trading around $1.18 after gaining 6.10% during the past 24 hours. The token has also advanced 39.83% over the past seven days. Its reported 24-hour trading volume currently stands above $1.14 billion.
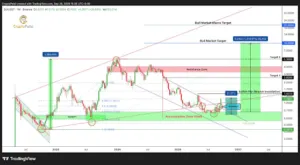
The weekly chart shows a prolonged decline marked by repeated lower highs. Price remained within a descending structure before reaching the broader accumulation zone. That region stretched approximately between $0.45 and $0.84.
Several reactions around that area showed renewed buying interest after extended weakness. The recovery later pushed price above the descending structure. Crypto Patel identified $0.87 as the channel breakout level.
The breakout also moved price above several Fibonacci references displayed across the weekly chart. Momentum strengthened as the token moved away from its lower accumulation area. The structure now places greater attention on the next resistance zone.
$1.42 Defines the Weekly Trend Threshold
Crypto Patel identifies $1.42 as the key macro trend-change level. His analysis requires a weekly close above that threshold for confirmation. Until then, the broader structure remains positioned between recovery and resistance.
Source: (Crypto Patel)
A sustained close above $1.42 would invalidate the bearish structure identified in the analysis. The projected upside levels then begin with $2.65. Further targets are marked at $5.36, $10, and $20.
These levels represent the targets presented within Crypto Patel’s chart framework. They remain projected price references rather than confirmed future market levels. Their relevance depends on the proposed weekly breakout occurring above $1.42.
The chart also presents an alternative path if resistance remains intact. Rejection beneath $1.42 could return price toward $0.84-$0.70. That region remains the stated accumulation area for another possible retest.
Liquidations Show Heavy Red-Side Pressure
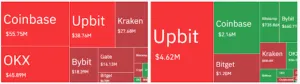
The liquidation chart shows substantially larger red-side volumes across major exchanges. Coinbase records approximately $55.75 million in red-side liquidations. OKX and Upbit follow with about $45.89 million and $38.76 million.
Source: (Coinglass)
Kraken records another $27.68 million in red-side activity. Bybit and Gate show approximately $18.39 million and $16.13 million. The distribution indicates that forced closures occurred across several major trading venues.
Green-side liquidations remain considerably smaller across the displayed exchanges. Upbit records about $4.62 million, while Coinbase shows approximately $2.16 million. Bitget, Bybit, Kraken, and OKX register substantially lower figures.
The liquidation imbalance shows where leveraged positions were forcibly closed during volatility. However, liquidation data does not capture every derivatives position across global markets. The chart therefore provides a view of observed activity rather than the complete market.
Taken together, the weekly structure and liquidation data point toward $1.42 as the central level. Price has recovered strongly, but the proposed macro shift still requires weekly confirmation. Until then, the chart retains both the breakout pathway and accumulation-zone retest scenario.