
Dogecoin Accumulation Signals Long-Term Setup
Dogecoin accumulation trend forms as price stabilizes near support while derivatives data shows reduced leverage and steady market participation.
- Dogecoin holds a key accumulation zone between $0.09 and $0.07, maintaining long-term structural support.
- Rising volume and steady price action reflect controlled accumulation with gradual buyer participation.
- Open interest stabilizes near $1B, indicating reduced leverage and a balanced derivatives environment.
Dogecoin accumulation trend continues to shape market structure as price stabilizes near key support levels, with technical patterns and derivatives data aligning toward a potential long-term setup.
Long-Term Structure Signals Accumulation Phase
A widely shared market post described a long-term bullish structure forming for Dogecoin. The chart outlines repeated cycles of consolidation followed by sharp expansions. These patterns serve as a reference for current price positioning.
The post noted that Dogecoin may reach higher targets over time. It emphasized that extended consolidation often precedes major price expansions. Market participants tend to overlook these quiet phases.
The structure shows a descending wedge nearing completion on higher timeframes. This formation typically aligns with potential reversal scenarios. It also coincides with a strong historical support region.
The identified accumulation zone ranges between $0.09 and $0.07. Price interaction within this band reflects consistent demand absorption. This range remains central to the ongoing setup.
Short-Term Price Action Reflects Controlled Recovery
Dogecoin as of writing trades near $0.097 after a modest upward move. The price has gained about 2.55% over the past 24 hours. This reflects mild bullish momentum following recent consolidation.
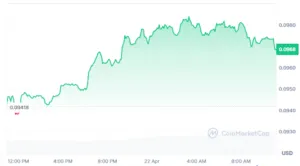
Source: Coinmarketcap
The chart displays a sequence of higher lows during the session. This pattern indicates steady buying interest at incremental levels. It also suggests a controlled accumulation phase rather than speculative movement.
Trading volume increased significantly, rising over 50% within the same period. Higher volume alongside price growth often supports trend continuation. It indicates active participation from market participants.
However, resistance remains near the $0.098-$0.10 range. Price has tested this zone multiple times without a clear breakout. Sustained movement above this level would define the next direction.
Derivatives Data Points to Market Stabilization
The derivatives landscape shows a shift toward reduced leverage. Open interest has declined from previous peaks above $5 billion. It now stabilizes closer to the $1 billion level.
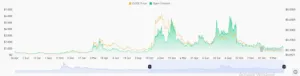
Source: Coinglass
Earlier cycles saw open interest rise alongside strong price rallies. This alignment indicated heavy leveraged participation during expansions. Such phases often lead to sharp corrections afterward.
A later increase in open interest occurred without matching price strength. This divergence suggested cautious positioning among traders. It reflected expectations of a breakout that did not fully materialize.
Current conditions show balanced activity between price and open interest. Reduced leverage lowers the risk of sudden liquidations. This environment supports gradual price development over time.


