
Render Falling Wedge Signals Trend Shift
Render falling wedge forms as price stabilizes near support while resistance tests build toward a potential structural breakout scenario.
- Render holds $1.49 support as falling wedge tightens, signaling potential reversal structure.
- Price trades near $1.82 with steady higher lows, showing controlled short-term recovery momentum.
- Break above $2.08 could trigger expansion toward $5 and higher targets if structure confirms.
Render falling wedge structure continues to shape market positioning as price stabilizes near support, while short-term recovery and broader technical patterns indicate a developing transition phase toward potential upside continuation.
Long-Term Compression Points to Structural Shift
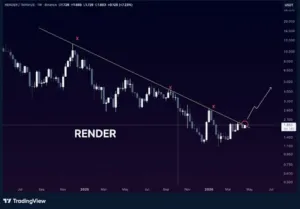
A widely circulated market post described Render forming a prolonged compression pattern. The chart shows a falling wedge developing across higher timeframes. This structure reflects sustained lower highs and narrowing price action.
Source: X
The same post stated that price remains significantly below its previous peak. It noted that such deep corrections often precede structural resets. Market attention appears limited during these phases.
Support near $1.49 continues to hold as a critical base. Price has tested this level without breaking lower. This behavior indicates consistent demand within that zone.
The falling wedge suggests potential reversal conditions. As price compresses, pressure builds toward resistance. This setup often precedes directional expansion once resistance weakens.
Short-Term Price Action Builds Momentum
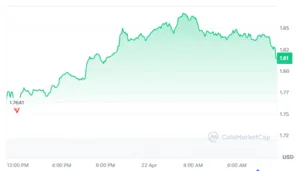
Render as of writing trades at $1.82 after recent gains. Price has advanced approximately 2.86% over the past day. The move follows a steady recovery from lower intraday levels.
Source: Coinmarketcap
The chart shows a sequence of higher lows during the session. This pattern reflects gradual buyer participation entering the market. It also supports a controlled recovery structure.
Price moved above the $1.80 region during the session. It then approached resistance near $1.85 before facing mild rejection. This level now acts as a short-term barrier.
Volume shows a slight decline despite rising prices. This divergence suggests the move remains measured rather than aggressive. It indicates steady accumulation rather than strong inflows.
Resistance Levels and Market Structure Define Outlook
The structural pivot remains near the $2.08 level. A widely shared post referenced this level as a key threshold. Movement above this area would signal a structure shift.
The same post outlined target progression toward $5 and higher levels. These targets align with previous consolidation ranges. They reflect potential expansion if momentum sustains.
Fundamental developments were also noted alongside technical conditions. Network growth continued despite declining price performance. This created a divergence between price and activity.
Risk remains defined below the $1.49 support level. A breakdown under this zone would invalidate the setup. Until then, price continues to trade within a controlled range.


