


PENGU Tests Key Resistance Amid Market Recovery
PENGU tests key resistance as volume declines, while its consolidation structure draws comparisons with PEPE’s earlier market expansion.
- PENGU continues testing resistance near the psychological $0.010 area, while declining volume signals weaker participation behind the recovery.
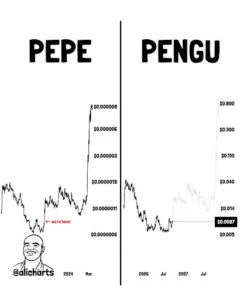
- The chart compares PENGU’s consolidation with PEPE’s earlier cycle, though the current structure remains unconfirmed by sustained breakout momentum.
- Support around $0.0096 remains important, while stronger volume could help determine whether PENGU can reclaim its recent resistance zone.
PENGU continues recovering within a volatile range, with resistance limiting advances while traders assess volume, support levels, and similarities with PEPE’s earlier cycle.
Recovery Remains Below Key Resistance
The price as of writing stands at around $0.00978, with the token gaining 3.16% over 24 hours. The move follows repeated attempts to reclaim the $0.0100 psychological threshold. Price remains below the session high near $0.01021.
That resistance has repeatedly triggered pullbacks during the displayed trading period. Buyers have defended the $0.0096 region during several separate declines. Therefore, the market remains positioned between nearby support and resistance.
Trading volume stands near $276.1 million over the latest 24 hours. That figure represents a 49.53% decline in reported trading volume. Meanwhile, price has continued recovering despite reduced market activity.
This creates a mixed short-term structure for PENGU. Rising price alongside lower volume suggests weaker participation behind the recovery. A stronger move may require renewed activity above current resistance.
PEPE Comparison Shapes the Market Structure
Ali Charts frames the current setup through a comparison with PEPE. The analysis points to similar phases across both meme coins. Those phases include attention, correction, consolidation, and renewed expansion.
Source: X
PEPE experienced an early surge before entering a prolonged corrective period. Price then formed an accumulation range before breaking sharply higher. That historical structure provides the basis for the current comparison.
PENGU has also experienced an initial advance followed by a substantial reset. Its price later spent extended periods moving within broader trading ranges. The recent recovery has now renewed attention around that structure.
However, the comparison remains a chart framework rather than confirmation. PENGU has not yet demonstrated sustained movement above its resistance band. Market structure can change quickly if nearby support levels fail.
Key Levels Define the Next Price Test
The $0.0087 area forms an important reference within the broader comparison. Above that level, the chart presents several progressively higher reference points. These include $0.014, $0.040, $0.110, $0.300, and $0.800.
Those levels represent the projected expansion path shown within the comparison. They should not be treated as confirmed future prices. The current chart remains concentrated closer to the lower reference zone.
In the short term, $0.0096 remains an important support area. Reactions around this level show buyers defending recent lows. A sustained break below it would weaken the current recovery structure.
Conversely, $0.0100 and $0.0102 remain the immediate resistance band. A move through $0.0102 would place price above the recent intraday ceiling. Stronger volume would provide additional confirmation for such a move.