


SUI Price Reversal Tests Key Support Levels
SUI price falls to $0.9652 as weekly Parabolic SAR turns bullish, while $0.95 support and $1.00 resistance guide the next move today.
- SUI holds near $0.9652 after breaking below $1.00, while weekly SAR turns bullish following an extended market decline and consolidation.
- Weekly Parabolic SAR dots have flipped below price, marking a technical shift after SUI spent months forming lower levels across 2026.
- Near-term support sits around $0.95, while $1.00 and $1.02 remain key recovery levels after the latest sharp selloff and rebound attempt.
SUI price action has shifted after a prolonged decline. A weekly Parabolic SAR reversal now signals changing momentum. The latest move places $0.9652 near critical short-term support levels.
Weekly SAR Signals a Potential Trend Shift
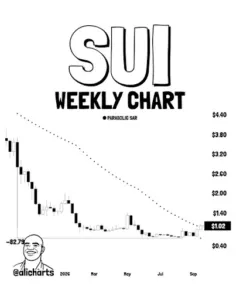
Ali Charts describes the weekly SAR flip as a major macro bullish signal. The post follows an 83% bear market decline that pushed SUI sharply lower overall. It argues that dots below price indicate a possible shift toward a broader uptrend.
Source: X
The weekly structure shows a long sequence of lower highs and lower lows. Price fell from the $4.40 area toward the $0.40 region during the decline. That weakness kept the Parabolic SAR dots positioned above price for many months.
After reaching the lower price range, SUI entered an extended consolidation phase. Trading repeatedly clustered around the $1.00 area before the latest breakout attempt. The sideways structure suggested selling pressure was gradually losing force across the broader market.
The latest SAR reversal now separates the current setup from earlier bearish conditions. Its weekly timeframe gives the signal broader technical relevance for longer-term market structure. Still, confirmation depends on subsequent candles and sustained upward price action ahead.
SUI Faces Short-Term Selling Pressure
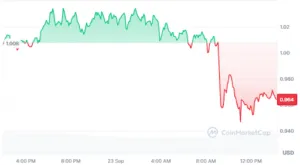
Short-term market momentum has weakened after SUI failed to hold above $1.00. The latest chart shows a decline toward approximately $0.96 during the session. The current SUI price stands near $0.9652, down 4.61% over 24 hours.
Source: Coinmarketcap
Earlier session trading remained concentrated between roughly $1.00 and $1.03. Buyers repeatedly tested the upper range without producing a lasting breakout. That rejection kept resistance near $1.02 and limited recovery during recent trading.
The sharp decline later pushed price toward the $0.96 region. A rebound toward $0.98 followed, but buyers could not reclaim $1.00. Price then returned toward $0.95 before finding temporary stability around that lower support level.
Trading activity remains elevated across the latest move lower. The chart records approximately $1.16 billion in 24-hour volume. Market capitalization stands near $3.95 billion, based on the displayed chart data.
Key Levels Define the Next Move
The immediate $0.95 region now represents support for the short-term structure. Holding that level could allow another consolidation range to develop. Breaking below it would weaken stabilization and expose deeper downside levels below current trading.
On the recovery side, $0.98 and $1.00 form nearby resistance zones. Reclaiming $1.00 would restore an important psychological threshold for buyers. Moving above $1.02 would provide stronger evidence of renewed buying pressure.
The weekly chart also identifies higher historical levels above the current range. The $1.40 area now appears as the next prominent reference. Beyond it, $2.00, $2.60, $3.20, and $3.80 become longer-range recovery levels if momentum persists.
The setup as of writing therefore combines a macro SAR reversal with short-term weakness. Those signals create distinct different timeframes that traders must separate carefully. The next weekly candles should determine whether recovery momentum can persist over several weeks.