


XRP Price Structure Faces a Critical Support Test
XRP price structure tightens as declining momentum tests rising support and traders watch for a decisive breakout.
- Binance recorded 418.5 million XRP in withdrawals on November 4, the largest daily outflow in nine months.
- Descending resistance and rising support are converging, leaving XRP traders watching for a decisive move.
- RSI remains below 40 while MACD stays negative, showing weak momentum despite signs that selling pressure may be easing.
XRP price structure is approaching a critical turning point as declining momentum meets rising support, while record Binance withdrawals draw attention to exchange balances.
Record Binance Withdrawals Put Exchange Supply Under Focus
Darkfost reported that Binance recorded 418.5 million XRP in withdrawals on November 4. The movement represented roughly $540 million at the reported valuation. It also marked the largest daily outflow recorded across nine months.
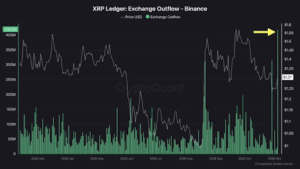
Source: X(Darkfost)
The latest figure exceeded October 29’s withdrawal total of 315 million XRP. That earlier movement followed the reported $6.3 billion Binance security incident. November’s outflow surpassed it by approximately 103.5 million tokens. The difference makes the latest exchange movement particularly notable.
The withdrawals arrived after XRP recovered above $1.30. That rebound followed a correction of approximately 27% from September’s peak. Meanwhile, the broader altcoin market also recorded a strong advance. TOTAL2 reportedly gained nearly $30 billion after the US midterm elections.
Large exchange withdrawals can reduce immediately available trading supply. Tokens transferred into private wallets may become less accessible for immediate selling. However, exchange outflows do not confirm accumulation by themselves. Internal transfers and custody movements can also produce substantial readings.
XRP Tests Support as Its Trading Range Narrows
The daily chart places XRP at $1.2329 after a 5.42% decline. Its latest candle opened at $1.3036 and reached $1.3254. It then dropped to $1.2277, showing renewed selling pressure.
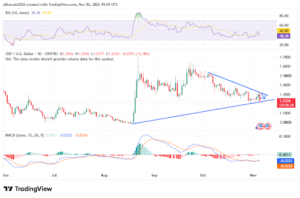
Source: Tradingview
Two converging trendlines define the current technical formation. Descending resistance connects lower highs established since October. Rising support begins near the August low around $1.00. Together, these boundaries form a narrowing structure.
The 1.20-1.23 region now carries immediate importance. XRP is trading close to this support after its latest decline. A daily close beneath the rising boundary could expose $1.15. Further weakness could bring the $1.10 area into view.
The upper boundary presents a separate challenge for buyers. Resistance currently approaches the $1.30 region. A sustained close above it would improve the short-term structure. The next resistance areas stand around $1.40 and $1.50.
Momentum Indicators Keep the Breakout Unconfirmed
The Relative Strength Index currently reads 38.22. Its moving average stands higher at 40.00. Both readings point to subdued momentum, with RSI remaining below 50.
The indicator has weakened since October’s decline. However, it has not reached the conventional oversold threshold. That leaves room for further weakness if sellers retain control. A move back above 50 would offer stronger evidence of improving momentum.
The MACD presents a similarly cautious picture. Its histogram reads approximately 0.0010, while both lines remain negative. The indicator lines have moved close together near the zero region. This may reflect easing bearish pressure, but no confirmed bullish crossover appears.
One limitation is the absence of volume data on this chart. That makes it harder to assess participation behind recent price movements. Stronger volume would help validate any breakout from the formation. Until then, the trendlines remain the clearest technical reference.
The immediate outlook rests on whether XRP can defend rising support. Continued Binance withdrawals may reduce exchange-side availability, but cannot guarantee demand. A recovery above $1.30 would strengthen the technical picture. A break below $1.20 would instead leave buyers defending lower levels.