

Bitcoin Price Outlook Ahead of 2026 Midterms
Bitcoin price outlook faces fresh scrutiny as historical post-election returns vary and BTC trades near $80,950 after a major correction.
- Bitcoin gained 30.91% after the 2010 midterms and 6.61% in 2014, before recording losses during the next two election cycles.
- BTC reached above $125,000 on the long-term chart before retreating toward $80,950, reflecting substantial volatility across recent market cycles.
- The November 2026 midterms provide another historical comparison, although previous post-election returns cannot reliably predict Bitcoin’s next price movement.
Bitcoin price outlook remains in focus as historical election returns contrast with Bitcoin’s latest correction from highs above $125,000.
Bitcoin’s Historical Post-Midterm Returns Show Different Outcomes
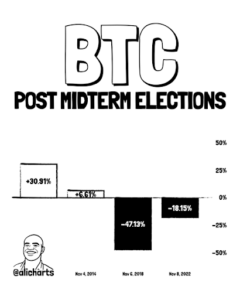
Ali Charts compared Bitcoin’s performance during the month following four U.S. midterm elections. The figures show gains of 30.91% in 2010 and 6.61% in 2014. However, subsequent cycles produced losses of 47.13% in 2018 and 18.15% in 2022.
Source: X(Ali Charts)
The 2010 election period delivered the strongest return among the four observations. Bitcoin advanced 30.91%, while the 2014 period produced a smaller 6.61% gain. These results show that both earlier periods ended with positive monthly performance.
The pattern changed after 2014, according to the historical figures presented. Bitcoin declined 47.13% following the 2018 midterms, marking the largest recorded loss. In 2022, the cryptocurrency fell another 18.15% during the measured month.
These four observations reveal contrasting outcomes rather than a consistent election-related price direction. The figures measure monthly performance after elections, not immediate election-day movements. They also do not establish that political events directly caused the recorded returns.
Bitcoin Retreats From Its Historical Peak Above $125,000
The long-term chart shows Bitcoin trading near $80,950 after a substantial correction. Earlier price action remained relatively subdued before the rally that developed around 2017. Bitcoin subsequently experienced several major advances, each followed by periods of considerable selling pressure.
During 2020 and 2021, Bitcoin climbed above $60,000 before reversing lower. The downturn continued into 2022, removing a substantial portion of its previous gains. However, the market later recovered as another upward phase developed.
The recovery strengthened during 2023 and continued through 2024 and 2025. Bitcoin eventually reached the chart’s highest visible region, above $125,000. Its latest displayed level near $80,950 places the price well below that peak.
The retreat represents a considerable reversal from Bitcoin’s highest recorded level on the chart. Nevertheless, the broader historical series still shows several previous recoveries following sharp downturns. The available graphic does not identify the specific causes behind each market cycle.
November 2026 Midterms Bring Another Comparison
The next U.S. midterm elections are scheduled for November 3, 2026. Ali Charts identifies volatility as a factor worth monitoring around the upcoming political event. Previous election periods, however, have produced both positive and negative monthly returns.
Bitcoin’s recent price correction adds another dimension to the historical comparison. The displayed price near $80,950 follows a retreat from levels exceeding $125,000. This movement demonstrates the scale of recent fluctuations without establishing the next market direction.
A further decline after the 2026 midterms would extend the negative sequence recorded in 2018 and 2022. Conversely, a positive monthly return would differ from those latest historical outcomes. Neither possibility can be established from the four earlier observations alone.
The Bitcoin price outlook therefore depends on future market performance rather than election history alone. The long-term chart records repeated rallies, corrections, and recoveries across multiple market cycles. Bitcoin’s performance during the month after November 2026 will provide the next comparison.