


Chainlink Faces Pullback Risk Despite $100 Target
Chainlink faces daily chart weakness as LINK trades below $12, while long-term projections point toward $26.30, $52.21, and $100.
- Chainlink trades near $11.374 inside a descending channel, with weakening MACD momentum keeping immediate recovery prospects uncertain.
- A possible re-entry between $9.45 and $8.00 depends on buyers defending support and forming a higher low.
- Long-term projections reach $26.30, $52.21, and $100, but LINK must overcome descending resistance before recovery gains confirmation.
Chainlink faces conflicting technical signals as short-term selling continues, while its longer-term chart leaves room for recovery if buyers defend support.
LINK’s Daily Chart Shows Persistent Selling
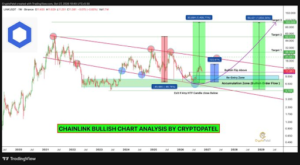
Crypto Patel’s latest outlook identifies 9.45–8.00 as a potential re-entry zone following an earlier gain exceeding 122%. The bullish scenario depends on buyers defending support and establishing another higher low. Meanwhile, the daily chart shows LINK struggling beneath descending resistance.
Source: X
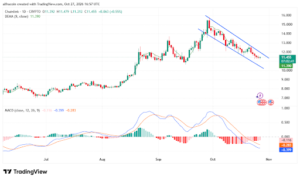
LINK traded at $11.374 on the supplied October 27 chart. Its price had retreated from September’s peak near $15.50, forming successive lower highs. Two descending blue trendlines now define the falling channel containing recent trading.
The decline followed a strong advance from roughly $8 in August. Buyers pushed LINK above $15 before selling pressure reversed that rally. Since then, rebounds have failed to restore the earlier upward structure.
The nine-period DEMA stands near $11.361, almost matching the displayed price. LINK is therefore trading close to its short-term average without establishing a clear recovery. A move above this indicator alone would not confirm a trend reversal.
Support and Momentum Remain Under Pressure
The 11.30–11.00 region provides an immediate area to monitor. LINK is approaching this range while remaining inside its descending channel. A decisive breakdown could expose the channel’s lower boundary near $10.
Source: Tradingview
However, the chart does not confirm that support has failed. Buyers could still defend the area and attempt to stabilize the decline. Repeated selling near these levels would increase the risk of another downward move.
The MACD reinforces the cautious short-term picture. Its blue line sits near -0.405, below the orange signal line at -0.284. The histogram remains negative around -0.121, indicating that bearish momentum persists.
Recent histogram bars appear less negative than earlier readings. That change could precede improving momentum, but it does not confirm a bullish crossover. Stronger price action and a shift in the MACD would provide firmer recovery evidence.
Long-Term Targets Depend on a Higher Low
The broader projection identifies $10.87 as the bullish-flip threshold. The proposed re-entry zone sits lower, between $9.45 and $8.00. A pullback there would need to attract buyers rather than trigger another breakdown.
A higher low could suggest that selling pressure is easing. However, entering the marked range would not guarantee a successful recovery. Buyers would need to defend support and eventually break the descending channel.
The longer-term chart sets $26.30 as its first major upside target. Further projections stand at $52.21 and $100, with no confirmed timeline. Reaching these levels would require substantial appreciation and sustained buying interest.
For now, the daily chart remains weaker than the longer-term bullish projection. LINK must preserve support, regain descending resistance, and establish stronger highs. Until those conditions develop, the higher targets remain possibilities rather than confirmed outcomes.