


ENA Whale Activity Meets a Critical Chart Test
ENA whale activity draws attention as exchange transfers rise and price approaches descending resistance, with momentum signals pointing to a critical test.
- A whale transferred 1.5 million ENA to Bybit, following another transfer of equal size six days earlier, according to on-chain records.
- ENA trades above its nine-day EMA near $0.2030, while descending resistance continues to limit recovery attempts on the daily chart.
- The wallet retains 672,000 ENA and 2.86 million SENA, valued around $743,000, as traders monitor exchange deposits and momentum.
ENA whale activity has drawn attention as repeated exchange transfers coincide with a technical recovery attempt beneath descending resistance.
Whale Transfers Reveal Sustained ENA Movement
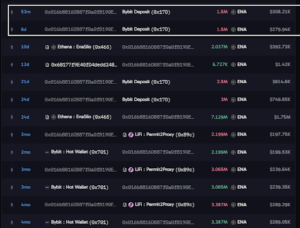
Professor on Chain (@Proxonchain) reported another 1.5 million ENA transfer to Bybit. The transaction occurred 53 minutes before the post was published. A separate transfer of equal size reached the exchange six days earlier.
Source: X
Together, these deposits account for three million ENA transferred within less than one week. Earlier records also show repeated movements involving Bybit and Ethena’s EnaSilo contract. Individual transactions have involved several million tokens over recent months.
Around ten days ago, the wallet received 2.037 million ENA from EnaSilo. Another transaction sent 2.5 million ENA to Bybit approximately 21 days earlier. A separate deposit involved three million ENA, according to the accompanying transaction records.
The wallet’s longer history includes movements involving 3.065 million ENA around three months ago. Additional records show transfers involving approximately 2.199 million and 3.387 million ENA. These transactions establish recurring activity, although they do not independently reveal the owner’s intentions.
Remaining Holdings and Exchange Deposits
Despite the repeated transfers, the wallet retains considerable exposure to Ethena-related assets. Professor on Chain reported holdings of 672,000 ENA and 2.86 million SENA. Their combined estimated value stands at approximately $743,000.
The remaining balance provides context for assessing the wallet’s latest exchange deposit. Transfers to trading platforms can precede sales, but they do not confirm completed transactions. Other explanations include liquidity management, collateral requirements, or internal asset transfers.
The distinction matters because transferred tokens should not automatically count as tokens sold. The available records establish movement between addresses, not the final execution of trades. Subsequent wallet activity could help clarify whether the deposits lead to selling.
Further transfers from EnaSilo may also help explain the wallet’s operating pattern. However, identifying a direct relationship between deposits and market orders requires additional evidence. Changes in wallet balances and exchange activity remain relevant details to monitor.
ENA Chart Tests Descending Resistance
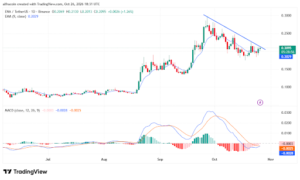
The daily chart places ENA near $0.2097, above its nine-day EMA at $0.2030. Price has recovered from the $0.18–$0.19 support region following its decline. However, a descending trendline continues to connect lower highs since late September.
Source: Tradingview
The immediate technical test concerns resistance around $0.22–$0.23. A daily close above the trendline could open a move toward $0.25. Further resistance appears between $0.27 and $0.29, near the previous peak.
Momentum remains mixed, despite the latest recovery above the moving average. The MACD and signal lines remain below zero, indicating that bearish momentum persists. Meanwhile, the histogram has contracted toward zero, suggesting selling pressure has eased.
On the downside, $0.20 and the EMA provide the first areas to watch. A sustained decline could bring the $0.18–$0.19 support zone back into focus. Meanwhile, exchange deposits and technical resistance offer separate signals requiring independent confirmation.