


ICP Price Tracks Breakout Pressure
ICP price analysis shows renewed momentum, stronger volume and a tightening monthly wedge as ICP approaches long-term resistance.
- ICP shows renewed momentum as stronger trading activity accompanies a sustained advance toward long-term monthly resistance.
- The monthly falling wedge continues narrowing while Stoch RSI turns upward from deeply depressed levels.
- The $3.40 region remains an important short-term reference as traders monitor momentum and potential consolidation.
ICP price analysis points to renewed momentum as a long-term wedge tightens, while stronger trading activity pushes the token toward key resistance.
ICP Gains Momentum as Trading Activity Accelerates
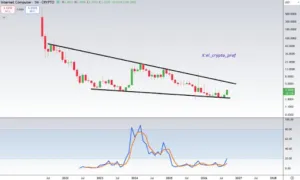
In a recent post, 𝕄𝕠𝕦𝕤𝕥𝕒𝕔ⓗ𝕖 described ICP as a potential bullish altcoin setup. The post cited a falling wedge forming since 2021 and improving Stoch RSI momentum. It also noted that ICP has not experienced a sustained altcoin bull run.
Source: X
Internet Computer as of writing trades at around $3.47, according to the displayed market data. The token has maintained a sequence of higher highs and higher lows during the latest session. Price also briefly moved above the $3.50 area before settling lower.
Market capitalization stands near $1.93 billion on the displayed market data. Meanwhile, 24-hour trading volume reached roughly $204 million during the session. Volume increased more than 108 percent alongside the sharp price advance.
The move developed through several stages rather than one isolated price spike. Buyers pushed through successive resistance areas as momentum strengthened. Pullbacks remained relatively contained, allowing the short-term upward structure to remain intact.
Monthly Wedge Keeps Long-Term Resistance in Focus
On the monthly timeframe, ICP remains inside a broad falling-wedge formation. The structure has developed since 2021 through lower highs and compressed price action. Its descending upper boundary continues defining the primary resistance area.
The lower boundary has provided repeated support as the wedge gradually narrows. Price remains positioned near the lower portion of that long-term structure. A monthly close above resistance would change the established technical pattern.
Momentum is also beginning to improve after an extended period near weaker levels. The Stoch RSI is moving toward the 20 threshold shown on the chart. The indicator previously displayed a comparable recovery phase around 2023.
That momentum shift does not confirm a breakout by itself. However, it places renewed attention on the descending resistance line. The setup combines compressed price action with improving momentum and stronger participation.
$3.40 Becomes an Important Short-Term Reference
The latest advance has brought ICP closer to a key technical decision point. A sustained move above the wedge boundary would provide stronger confirmation. Until then, the descending resistance line remains central to the monthly structure.
The $3.40 region also becomes relevant after the latest intraday advance. Holding above that area would preserve the recent sequence of higher short-term lows. A deeper retracement could instead return attention toward the $3.30 region.
The current structure contains rising momentum alongside established overhead resistance. Recent volume expansion provides additional context around the move toward higher levels. However, the broader monthly pattern remains unresolved without a confirmed resistance break.
The chart therefore presents a developing setup rather than a confirmed long-term reversal. Short-term strength is visible, while the monthly wedge continues defining a broader price structure. Future movement around resistance will determine whether the compression eventually gives way to expansion.