


SUI Price Tracks Golden Cross Setup
SUI price examines the approaching golden cross, stronger trading activity and historical rallies as SUI tests a key trend shift.
- SUI’s 50-day SMA is approaching the 200-day SMA, creating conditions for another potential golden-cross formation.
- Earlier golden crosses preceded rallies exceeding 220%, while current price action shows a recovery from prolonged weakness.
- Exchange activity remains concentrated across major venues, while recent seven-day gains add momentum to the developing setup.
SUI price shows the token entering a closely watched technical phase, with moving averages converging after a prolonged decline and recent market activity strengthening.
Golden Cross Formation Draws Attention
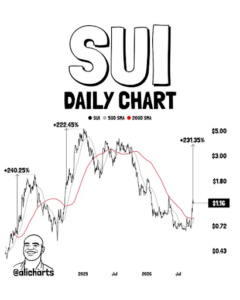
Ali Charts recently pointed to SUI approaching another golden cross formation. The setup involves the 50-day SMA moving toward the 200-day SMA. Such crossovers are commonly monitored when assessing longer-term trend changes.
Source: X
SUI is priced at $1.16, according to the supplied market data. The token has gained 15.37% over seven days despite a marginal daily decline. Its reported 24-hour trading volume stands above $1.07 billion.
The current structure follows an extended decline visible across the supplied chart. Price moved toward the $0.72 region before beginning a broader recovery. That recovery has brought the shorter moving average closer to the longer average.
The approaching crossover remains the main technical feature under observation. A confirmed move above the 200-day SMA would establish the golden cross. Until confirmation, the averages remain in a convergence phase.
Earlier Crosses Offer Historical Context
The chart identifies golden crosses from December 2023 and October 2024. Those events preceded rallies of approximately 240.25% and 222.45%, respectively. The historical moves provide the basis for comparing the current setup.
The earlier rallies developed after SUI transitioned from weaker technical conditions. Price subsequently established stronger upward trends during those periods. However, each cycle developed under different market conditions and liquidity environments.
Ali Charts uses those previous moves to frame a potential 230% rally. Applying that historical comparison produces a projection toward the $4 region. The chart presents $4 as a target connected directly to that historical pattern.
Moving averages remain lagging indicators because they respond to previous price movements. Therefore, a crossover confirms developing momentum rather than anticipating every market reversal. Price behavior following the crossover remains important for evaluating the pattern.
Exchange Activity Adds Market Context
The supplied exchange-flow chart shows substantial activity across major trading venues. Binance records the largest displayed block at approximately $1.91 million. Coinbase follows with about $1.38 million on the opposite side.
Other venues also show notable activity during the selected timeframe. OXX records roughly $537,000, while Kraken reaches approximately $496,360. Gate, Upbit, Bybit and Bitstamp account for additional displayed flows.
The second panel shows Coinbase at approximately $199,180 and Binance near $196,580. Kraken records around $84,430, while Upbit reaches approximately $64,930. The distribution indicates that short-term activity remains concentrated among established exchanges.
The exchange chart uses a one-hour timeframe in the supplied image. Therefore, those figures represent a short-term snapshot rather than longer-term positioning. Combined with recent weekly gains, the data places SUI within an active technical transition.
The immediate focus remains the relationship between the 50-day and 200-day SMAs. A confirmed golden cross would complete the technical formation shown by the chart. The historical rallies provide context, while subsequent price action will determine whether this cycle develops similarly.