
TRON Leads Layer 1 Networks in Monthly Revenue
Layer 1 blockchain revenue data puts TRON ahead at $23.85 million, while Ethereum and Solana trail in the latest 30-day ranking.
- TRON generated $23.85 million in 30-day revenue, nearly four times Ethereum’s $6.04 million, leading the ten-network ranking.
- Monad recorded the lowest valuation multiple at 58x annualized revenue, while BNB Chain exceeded 5,300x in the comparison.
- Revenue offers another way to compare blockchain networks, but application earnings, token economics, and growth also affect valuation.
Layer 1 blockchain revenue data places TRON well ahead of competitors, with $23.85 million generated over 30 days, according to the supplied ranking.
TRON Opens a Wide Lead in Monthly Revenue
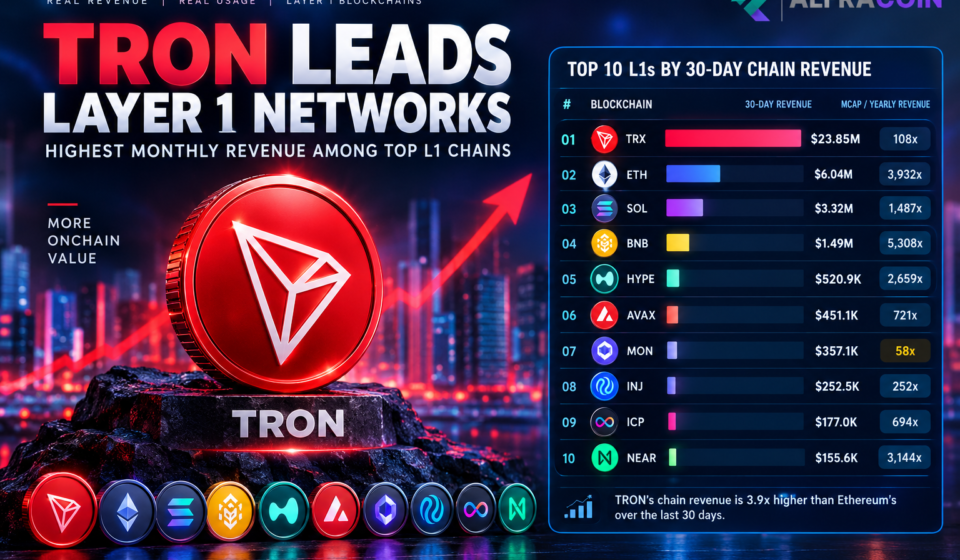
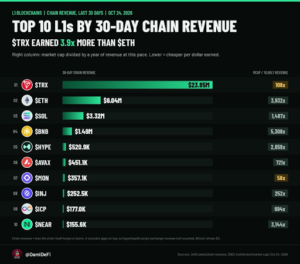
Dami-Defi’s latest X post ranked the top Layer 1 blockchains by monthly revenue, placing TRON first with $23.85 million over the past 30 days. The comparison shifts attention from market capitalization to direct chain revenue, showing Ethereum at $6.04 million and Solana at $3.32 million during the same period.
Source: X
TRON’s reported revenue is approximately 3.9 times Ethereum’s total during the measured period. The gap separates the leading network from every other blockchain listed. It also places TRON comfortably ahead of the remaining competitors in the ranking.
BNB Chain ranks fourth, generating $1.49 million over 30 days. Hyperliquid’s HYPE follows with $520,900, while Avalanche records $451,100. The remaining networks generate less than $400,000 each in the displayed period.
Monad records $357,100, followed by Injective at $252,500. Internet Computer produces $177,000, while NEAR Protocol sits tenth with $155,600. These figures show how unevenly reported revenue is distributed across the selected networks.
Revenue Multiples Show Different Valuations
The chart compares market capitalization with annualized revenue, revealing substantial differences between networks. TRON trades at approximately 108 times annualized revenue, while Monad sits at 58 times. These are the two lowest multiples shown in the ranking.
Injective’s multiple stands at 252 times annualized revenue, followed by Avalanche at 721 times. Internet Computer records 694 times, while Solana reaches approximately 1,487 times. The figures suggest that market valuations differ considerably relative to the revenue reported.
Ethereum’s multiple approaches 3,932 times annualized revenue, according to the graphic. BNB Chain records an even higher multiple, exceeding 5,300 times. These ratios reflect the relationship between market capitalization and the current revenue pace, not guaranteed future earnings.
A lower multiple does not automatically establish that a token is undervalued. Revenue may change, while token supply, growth expectations, and network economics also influence valuation. The figures provide a comparison point rather than a standalone investment conclusion.
Network Revenue Does Not Capture Every Business
The chart measures chain revenue, which does not necessarily include income earned by applications built on top. It specifically excludes Hyperliquid’s perpetual trading business, illustrating a limitation when comparing different blockchain models. Application-level earnings can therefore make an ecosystem’s wider economic activity appear different from its chain revenue.
This distinction matters because networks support different services and transaction patterns. Some activity generates fees directly for the underlying chain, while other income accrues to separate applications. A revenue ranking cannot fully capture these differences without additional data.
The displayed figures also cover only 30 days, making longer-term comparisons important. Network fees and activity can fluctuate, so annualizing one month’s revenue assumes that pace continues. If activity changes, the resulting valuation multiples can shift considerably.
TRON leads this ranking by a substantial margin, with Ethereum and Solana following. Yet revenue alone cannot establish which network offers the strongest long-term prospects. A fuller comparison would consider sustained revenue, application activity, token economics, market capitalization, and how value reaches tokenholders.