


Bitcoin Breakout Watch: Triangle Pattern Tests Buyers
Bitcoin breakout prospects hinge on a tightening triangle, weakening bearish momentum and resistance near $84,000 as traders await confirmation.
- Bitcoin’s daily chart shows converging trendlines, with rising support and descending resistance tightening the range before a potential directional move.
- The MACD remains below its signal line, although shrinking negative histogram bars suggest selling momentum may be easing across recent sessions.
- A break above $84,000 could revive bullish momentum toward $87,000, while losing rising support may expose lower levels near $80,000.
Bitcoin breakout prospects are drawing attention as BTC consolidates within a tightening triangle following a strong rally and subsequent retreat.
Bitcoin Price Holds Within a Tightening Triangle
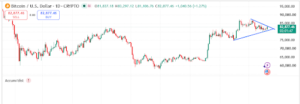
Bitcoin is trading inside a narrowing formation after retreating from September’s highs. The daily chart places its latest price at $82,829.32, up 1.21%. Meanwhile, converging trendlines show buyers defending higher lows while sellers cap successive recovery attempts.
Source: Tradingview
The upper blue trendline connects lower peaks formed during the recent correction. Each rebound has encountered resistance below the preceding high, limiting upward progress. Consequently, sellers continue challenging advances as Bitcoin approaches the upper boundary.
The ascending support line tells a different part of the story. Buyers have repeatedly entered before price revisits earlier lows. This pattern has gradually lifted the floor beneath Bitcoin despite continued resistance overhead.
The resulting triangle reflects a market approaching a decision point. Price fluctuations have narrowed as both trendlines converge toward the formation’s apex. However, the pattern alone cannot establish whether the eventual breakout will favour buyers or sellers.
MACD Shows Bearish Momentum Easing
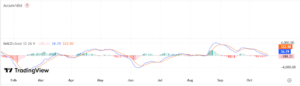
The MACD indicator provides another measure of Bitcoin’s current market conditions. Its blue line stands near 30.47, below the orange signal line at 321.75. The histogram remains negative, recording approximately -291.28 on the displayed chart.
Source: Tradingview
These readings indicate that bearish momentum has not fully disappeared. The MACD line remains beneath its signal line despite price stabilisation. Therefore, the indicator has yet to provide a confirmed bullish crossover.
However, the recent red histogram bars appear smaller than earlier negative readings. This contraction suggests that downward momentum may be losing some strength. Further improvement would strengthen the recovery case, although confirmation remains necessary.
A renewed expansion in negative histogram bars would present a different picture. It could indicate that selling pressure is returning as Bitcoin tests support. Traders will therefore watch the MACD alongside price action rather than treating either signal independently.
Breakout Levels Define Bitcoin’s Next Direction
The $84,000 region represents an important area for Bitcoin’s immediate recovery attempt. A daily close above descending resistance could signal that buyers are overcoming recent selling pressure. Sustained strength beyond that zone would bring the previous 87,000–88,000 peak area back into focus.
However, resistance may continue limiting advances near the triangle’s upper boundary. A brief move above resistance without a sustained close could produce a failed breakout. Price holding above the broken trendline would offer stronger evidence of continued demand.
The lower trendline remains equally important as the formation approaches its apex. A confirmed breakdown could expose the $80,000 region as the next reference point. Further weakness might bring support around $78,000 and $76,000 into view.
Bitcoin previously advanced from approximately $64,000 toward $86,000 before entering its current consolidation. That rally established the broader upward move preceding the present technical formation. Whether the triangle becomes a continuation pattern depends on the next confirmed move.
For now, neither side has secured a decisive advantage. Buyers must overcome descending resistance, while sellers need to break the rising support line. Until either boundary gives way convincingly, Bitcoin remains range-bound, with the MACD offering a cautious reading of momentum.